
AI-native strategies · built in the open
Trading just got an
AI-native era.
Come build it with us.
Balder is an AI-native trading desk. An agent loop researches, tests and trades — reading filings, option chains and institutional flow at a scale no analyst team can match — and every position it takes is published, on entry and on exit.
Members get more than signals — the tools, the structure reads, and the reasoning behind every call.
Backdrop: cumulative per-trade return across 130 closed trades (07-31–10-02) — equal weight, a sum of trade returns, not a portfolio return.
Calls that worked
Balder’s Position — the four best, entry to exit
The top four closed positions from the long book. Gold marks where the book disclosed the entry, white where it announced the exit — and because both were published before the outcome was known, the full record, losers included, is one click away.
The products
Everything this desk publishes
10 live products, each with its own page — how it's built, what it found, and what it's saying right now. Two are free and need no account.
Market Risk Playbook
Today’s likely range, the level that matters, and what happened the last few thousand times the index sat here.
Open the playbook →Tech Risk Playbook
The same read on the Nasdaq 100, with its own volatility index and its own calibration — tech does not behave like the index.
Open the playbook →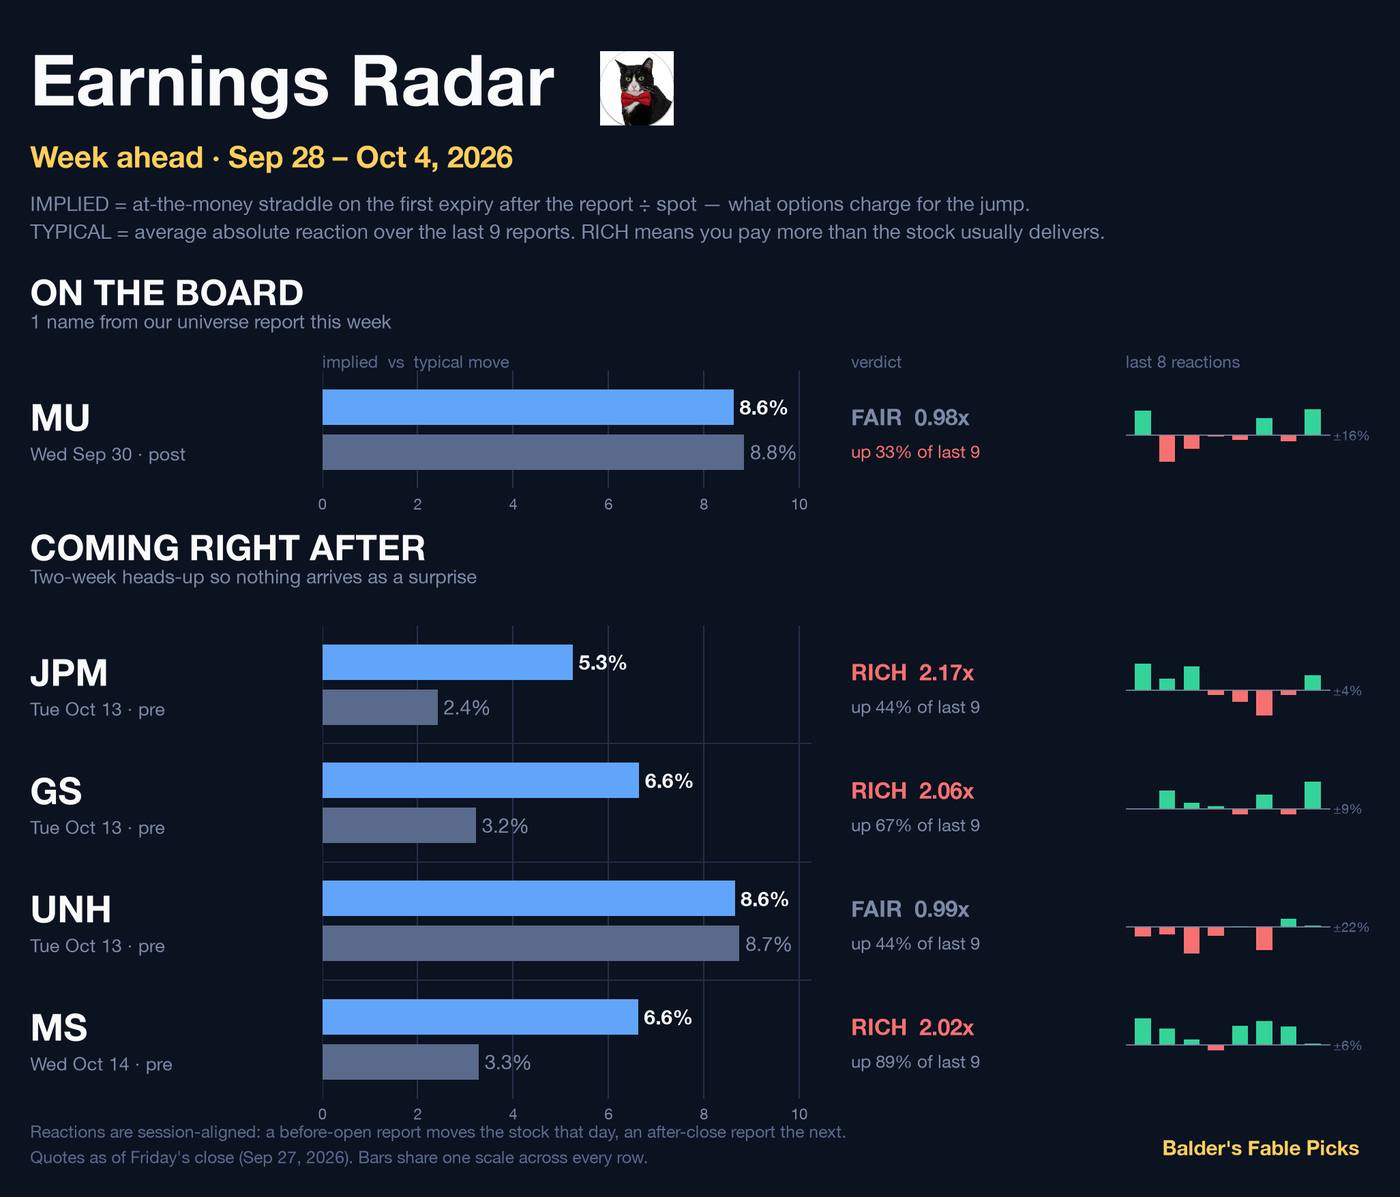
Earnings Radar
What options charge for the jump versus what the stock actually does.
Open the radar →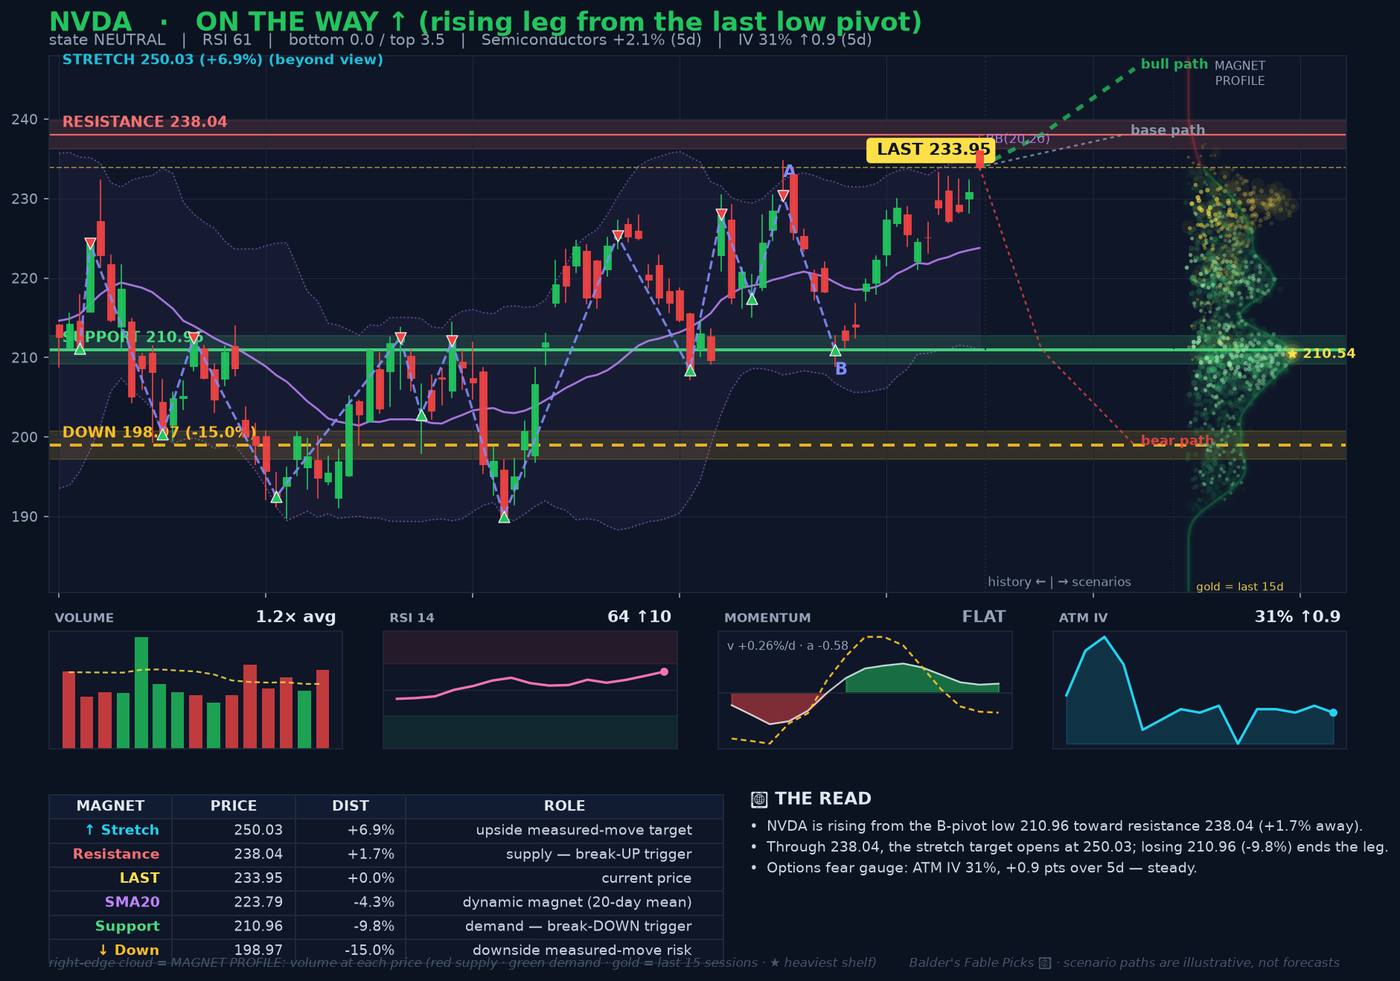
Structure Read
Pivots, break triggers, measured targets and the read in words.
Open a chart →16:00–09:30 CME futures
Sat & Sun Hyperliquid perps
Markets around the clock
SPX, NDX and 13 stocks priced overnight and at weekends — real prints, no gaps.
Open the board →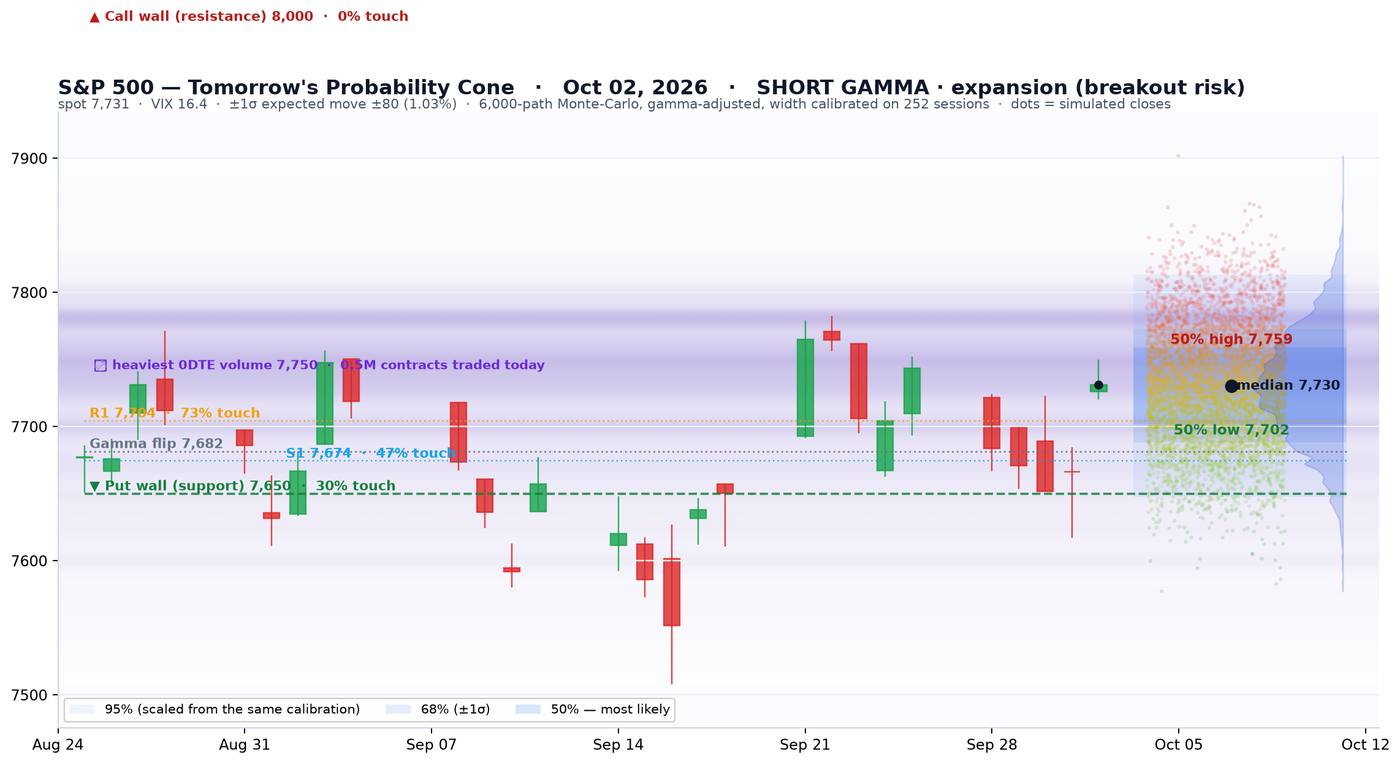
SPX probability cone
A distribution on the next close — 6,000 gamma-adjusted paths.
Open the forecast →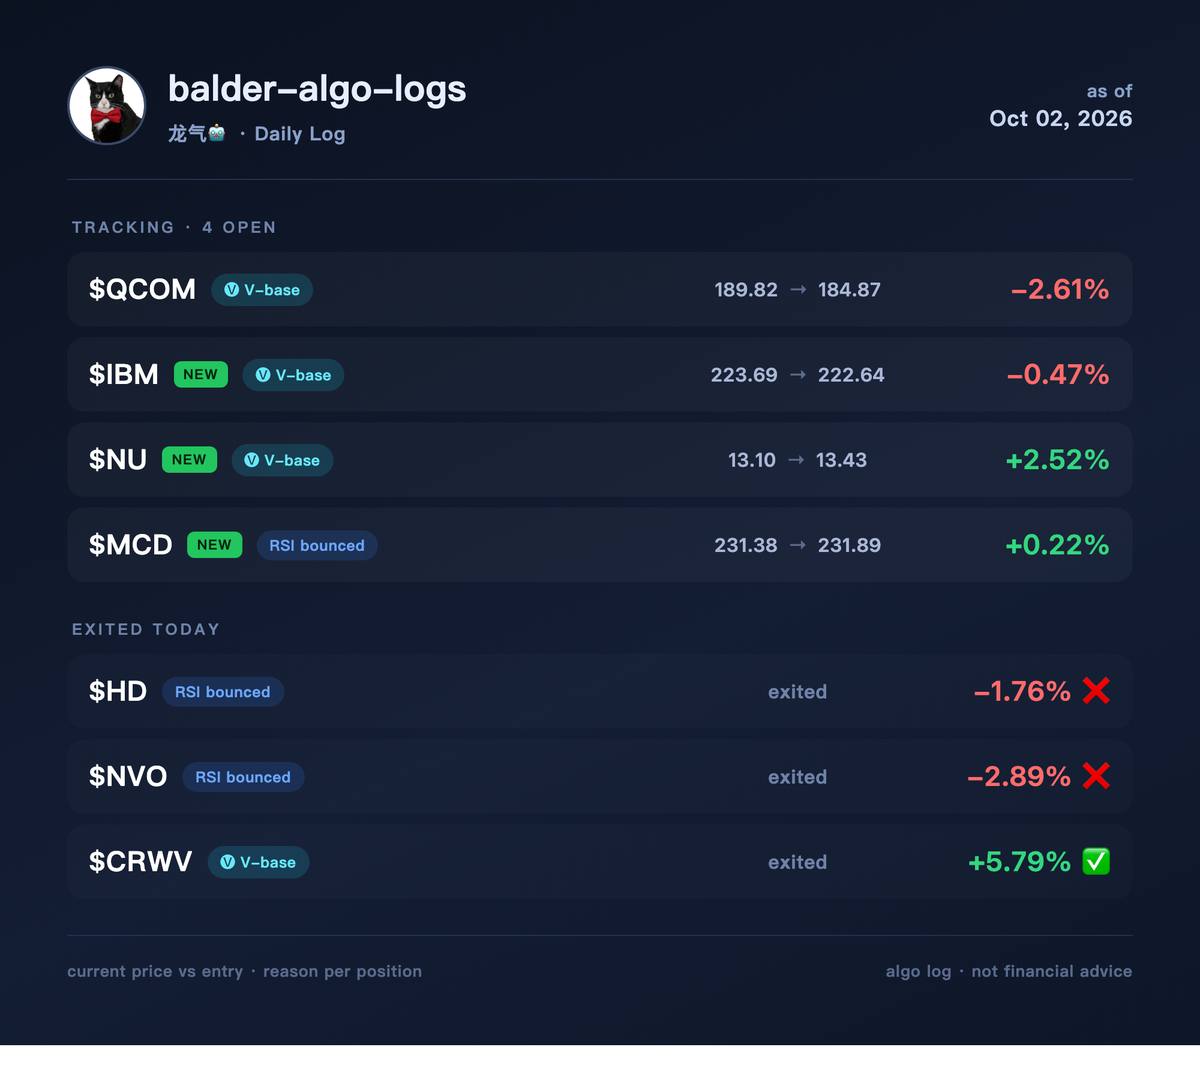
龙气🤖 algo-logs
Two short-term strategies, hours to days, reported live and summed up after the close.
See every trade →Event tracker
Dated catalysts that can reprice a name in one session — and what the tape has done since each one opened, measured against the market.
Open the tracker →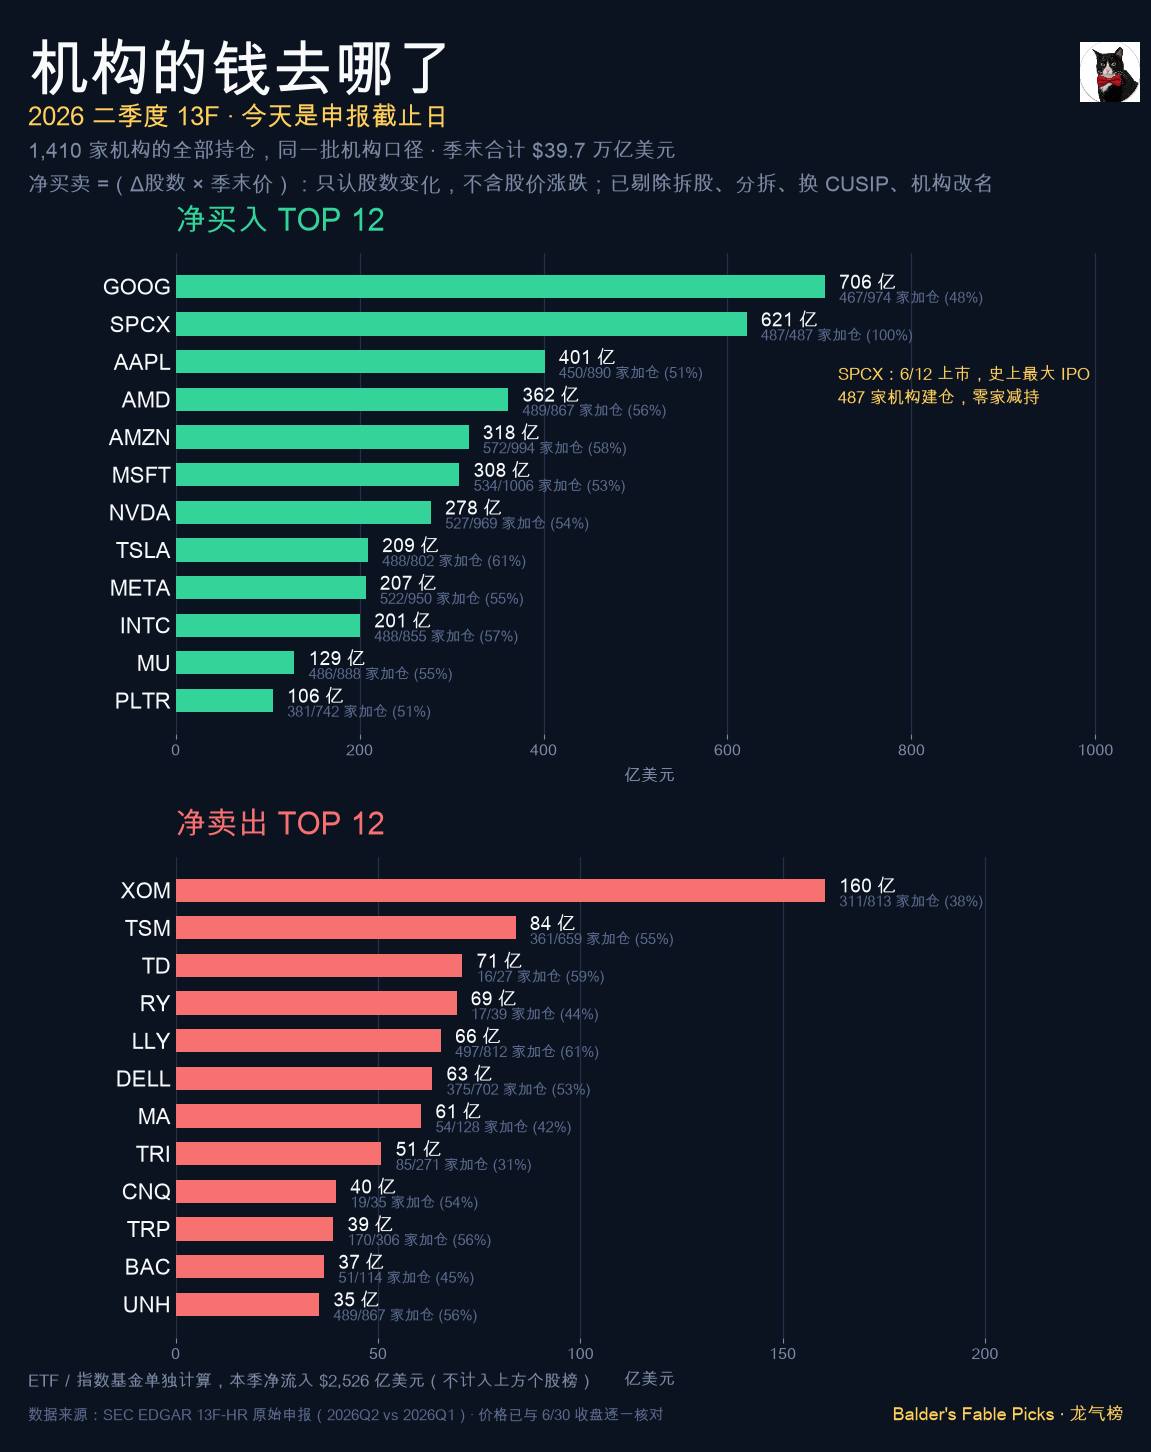
Research
Studies tested against empirical nulls — and the ones that failed are published the same as the ones that did not.
Read the studies →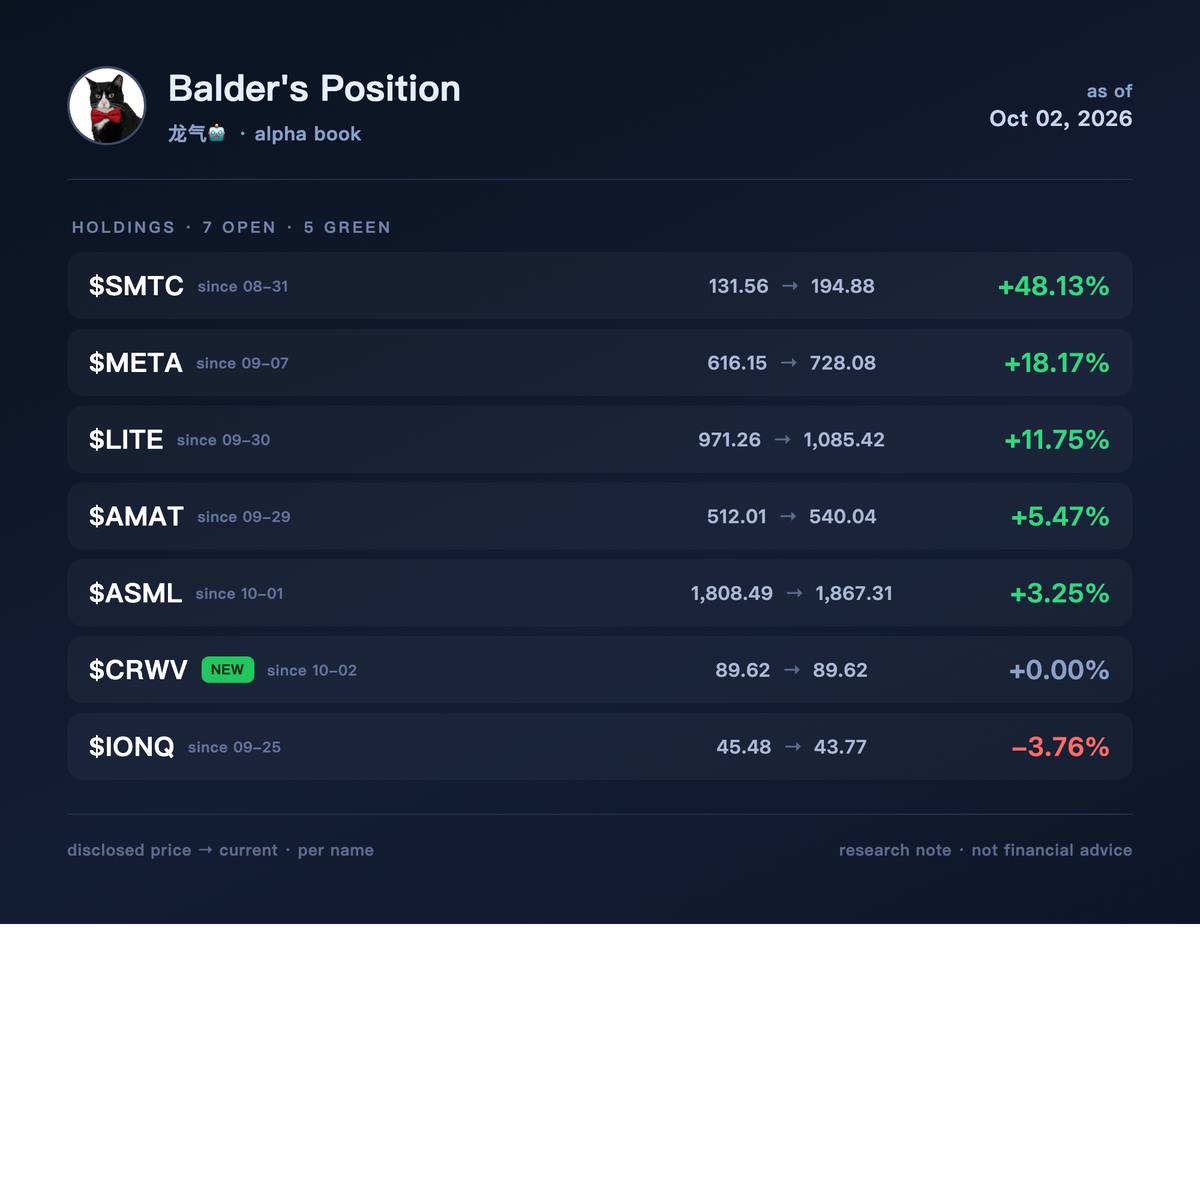
Balder’s Position
Uptrend trend-following, published after the close, entry and exit both disclosed.
See the record →Why this is different
Anyone can run a model. Almost nobody checks the inputs.
Most market coverage is a vendor feed with a chart on top. This desk reads the primary record and fixes what the feeds get wrong — which is where the edge actually lives now that everyone has the same models.
We read the filings, not a feed
The Q2 flow panel is rebuilt from SEC’s raw 13F data across 1,410 managers and 4.77M holdings — then corrected for stock splits, entity migrations, CUSIP changes and filer misreporting. Every one of those makes a vendor number quietly wrong.
Details other people get wrong
An earnings reaction lands on a different day for a pre-market reporter than an after-close one. Measure both alike — as most sources do — and a fairly-priced option looks 4× too expensive. Ours is session-aligned.
Upstream of the news
Form 4 insider buys and 13D stakes are pulled straight off EDGAR twice a day, filtered to open-market purchases with the insider’s own cash. The filing is public before anyone writes it up.
The loop keeps compounding
The research agent runs continuously — testing ideas, killing the ones that fail, and promoting what survives. Three engines live today. The ones that reach the site are the ones that already earned their place.
Highlights
Posts that travelled
Written by Balder, not by the machine — the desk publishes the data, these are the calls and arguments around it. Numbers are the real reach on X. Balder writes mostly in Chinese; these are the originals, unedited.
又有人问我Fable是怎么预测财报的,我来泄露一下商业机密吧。 首先肯定不是你直接问Fable这个财报怎么看,这样做是没用的,虽然Fable拥有比我们所有人都多的知识,但是没有结构性的输入就不会有结构性的输出。
Read it on X →Michael Burry重仓 11%仓位做空 $NBIS 今天遭到30%的暴涨。 在这种毁灭性轧空之下,MB决定加大做空仓位。 substack还能继续提供无限弹药吗?
Read it on X →Jane Street 在 7 月 引起Situational Awareness 大崩溃中录得 150 亿美元亏损,几乎抹去了去年大牛市中获得利润的一半。 所以就连天天割散户韭菜的,地表最强大量化机构也在今年七月折戟。 所以我们度过了毁灭性的7月 迎来了充满希望的八月。
Read it on X →Fable认为 $LITE 财报要上涨 $GLW 侧击还是 $LITX 直接轰入。
Read it on X →$MU 的IV出现了崩溃式的下跌,今天不涨不跌,昨天买的期权都会自动减10% 这究竟是什么原因,是谁在拼命卖出 $MU 的期权。
Read it on X →$MU 这种情况,就很容易引起严重的Gamma squeeze,这些人卖出的低价期权一下成了燃料罐。末日期权IV直接从70%飙升到接近100% 所以我们说目前这个期权价格是mis-price,后面他们肯定要修复的。
Read it on X →Recent opinion
The read, in order
Balder’s own posts, newest first, in the language they were written in. Click any of them to open the original on X.
1.1K views
6.3K views
0 views
6.6K views
27K views
42K views
12K views
4.3K views
0 views
14K views
7.8K views
15K views
Markets around the clock
The market closes.
The world doesn’t.
Friday 4pm the tape stops, and for 65 hours every app you own shows you a dead number. Meanwhile Tokyo trades, futures move, and by Monday’s open the gap has already happened — you just weren’t allowed to watch it.
Track the market when the market is shut
This one forecasts nothing. It is a live board that never goes dark: cash index during US hours, CME futures overnight, and Hyperliquid perps at weekends — so there is a real price at 3am on a Sunday instead of a stale Friday close. Every number is an actual print from a named venue. Only tickers with a genuine 24/7 venue appear; nothing is invented to fill a gap.
- Indices — SPX and NDX: cash in RTH, CME futures (ES/NQ minus basis) overnight, Hyperliquid US500/USTECH perps at weekends.
- Single stocks — 13 names with a real round-the-clock venue: US consolidated print 4am–8pm ET, then builder-dex perp marks overnight, validated to track spot within about 1%.
- No fabricated quotes — if a name has no genuine overnight venue, it is simply not on the board.
SPX forecast
Tomorrow’s probability cone
A forecast, and deliberately separate from the 24/7 board — that one reports prints, this one puts a distribution on tomorrow’s close. Six thousand Monte-Carlo paths, gamma-adjusted, anchored on the live option chain: where dealers damp or amplify moves, and the walls that tend to pin price.
LAST SESSION · 2026-10-02
A 68% band that contains the close 86% of the time is too wide, not “86% accurate”. The honest read is that the cone is currently conservative, and tightening it is open work. We publish the number either way.
Every session on the ledger
The band published that morning, and where the index actually closed.
| Session | 68% band | 95% band | Close | Expected move | Result |
|---|---|---|---|---|---|
| 2026-10-02 | 7,589 – 7,747 | 7,512 – 7,824 | 7,722.72 | ±79.0 | inside |
| 2026-10-01 | 7,576 – 7,729 | 7,501 – 7,805 | 7,666.45 | ±76.9 | inside |
| 2026-09-30 | 7,594 – 7,748 | 7,519 – 7,824 | 7,651.54 | ±77.2 | inside |
| 2026-09-29 | 7,606 – 7,761 | 7,531 – 7,837 | 7,670.84 | ±77.4 | inside |
| 2026-09-28 | 7,687 – 7,766 | 7,665 – 7,788 | 7,683.69 | ±72.8 | 68% miss |
| 2026-09-25 | 7,634 – 7,772 | 7,567 – 7,840 | 7,743.41 | ±69.0 | inside |
| 2026-09-24 | 7,646 – 7,763 | 7,625 – 7,824 | 7,704.13 | ±69.0 | inside |
| 2026-09-23 | 7,724 – 7,801 | 7,703 – 7,863 | 7,706.03 | ±69.5 | 68% miss |
| 2026-09-22 | 7,687 – 7,796 | 7,665 – 7,861 | 7,764.64 | ±73.6 | inside |
| 2026-09-21 | 7,573 – 7,717 | 7,503 – 7,788 | 7,764.70 | ±72.0 | 68% miss |
| 2026-09-18 | 7,588 – 7,668 | 7,565 – 7,691 | 7,650.50 | ±74.6 | inside |
| 2026-09-17 | 7,468 – 7,637 | 7,385 – 7,720 | 7,637.76 | ±84.8 | 68% miss |
| 2026-09-16 | 7,501 – 7,667 | 7,420 – 7,750 | 7,551.81 | ±83.3 | inside |
| 2026-09-15 | 7,538 – 7,700 | 7,460 – 7,780 | 7,585.73 | ±81.0 | inside |
| 2026-09-14 | 7,595 – 7,691 | 7,571 – 7,715 | 7,619.98 | ±76.5 | inside |
| 2026-09-11 | 7,596 – 7,745 | 7,569 – 7,775 | 7,656.98 | ±87.0 | inside |
| 2026-09-10 | 7,559 – 7,714 | 7,483 – 7,791 | 7,591.70 | ±78.0 | inside |
| 2026-09-09 | 7,598 – 7,748 | 7,525 – 7,822 | 7,636.36 | ±75.2 | inside |
| 2026-09-08 | 7,683 – 7,775 | 7,662 – 7,813 | 7,673.52 | ±69.0 | 68% miss |
| 2026-09-04 | 7,687 – 7,788 | 7,665 – 7,818 | 7,718.60 | ±70.4 | inside |
| 2026-09-03 | 7,599 – 7,694 | 7,577 – 7,717 | 7,747.71 | ±73.3 | outside |
| 2026-09-02 | 7,553 – 7,710 | 7,477 – 7,787 | 7,666.60 | ±78.5 | inside |
| 2026-09-01 | 7,611 – 7,756 | 7,540 – 7,828 | 7,631.47 | ±72.9 | inside |
| 2026-08-31 | 7,639 – 7,779 | 7,570 – 7,849 | 7,686.14 | ±70.4 | inside |
| 2026-08-28 | 7,686 – 7,787 | 7,664 – 7,817 | 7,711.76 | ±71.1 | inside |
| 2026-08-27 | 7,601 – 7,749 | 7,529 – 7,823 | 7,730.99 | ±74.3 | inside |
| 2026-08-26 | 7,600 – 7,749 | 7,527 – 7,823 | 7,675.70 | ±74.8 | inside |
| 2026-08-25 | 7,589 – 7,741 | 7,515 – 7,816 | 7,677.28 | ±76.2 | inside |
| 2026-08-24 | 7,593 – 7,740 | 7,521 – 7,813 | 7,652.86 | ±73.8 | inside |
| 2026-08-21 | 7,599 – 7,747 | 7,527 – 7,820 | 7,674.37 | ±73.9 | inside |
| 2026-08-20 | 7,564 – 7,718 | 7,489 – 7,795 | 7,641.16 | ±77.5 | inside |
| 2026-08-19 | 7,634 – 7,780 | 7,564 – 7,851 | 7,707.98 | ±72.6 | inside |
| 2026-08-18 | 7,616 – 7,768 | 7,543 – 7,843 | 7,691.76 | ±75.8 | inside |
| 2026-08-17 | 7,671 – 7,819 | 7,598 – 7,893 | 7,745.06 | ±74.5 | inside |
| 2026-08-14 | 7,753 – 7,807 | 7,731 – 7,829 | 7,785.76 | ±70.7 | inside |
| 2026-08-13 | 7,770 – 7,819 | 7,748 – 7,841 | 7,798.99 | ±72.4 | inside |
| 2026-08-12 | 7,724 – 7,801 | 7,703 – 7,823 | 7,748.50 | ±70.7 | inside |
| 2026-08-11 | 7,656 – 7,804 | 7,584 – 7,878 | 7,728.20 | ±74.5 | inside |
| 2026-08-10 | 7,677 – 7,803 | 7,613 – 7,825 | 7,753.11 | ±72.6 | inside |
| 2026-08-07 | 7,682 – 7,761 | 7,660 – 7,784 | 7,757.64 | ±74.0 | inside |
| 2026-08-06 | 7,669 – 7,747 | 7,646 – 7,772 | 7,709.96 | ±75.3 | inside |
| 2026-08-05 | 7,673 – 7,753 | 7,649 – 7,776 | 7,723.55 | ±75.5 | inside |
| 2026-08-04 | 7,608 – 7,752 | 7,538 – 7,808 | 7,736.52 | ±80.2 | inside |
| 2026-08-03 | 7,499 – 7,618 | 7,476 – 7,641 | 7,600.50 | ±75.5 | inside |
| 2026-07-31 | 7,378 – 7,543 | 7,298 – 7,625 | 7,489.72 | ±82.7 | inside |
| 2026-07-30 | 7,307 – 7,471 | 7,228 – 7,552 | 7,437.63 | ±82.1 | inside |
| 2026-07-29 | 7,333 – 7,501 | 7,251 – 7,584 | 7,316.15 | ±84.5 | 68% miss |
| 2026-07-28 | 7,309 – 7,479 | 7,227 – 7,563 | 7,428.78 | ±85.0 | inside |
| 2026-07-27 | 7,375 – 7,551 | 7,289 – 7,639 | 7,413.18 | ±88.5 | inside |
| 2026-07-24 | 7,317 – 7,493 | 7,231 – 7,581 | 7,411.98 | ±88.5 | inside |
| 2026-07-23 | 7,371 – 7,504 | 7,302 – 7,529 | 7,408.30 | ±78.8 | inside |
Home/Products/Market Risk Playbook
Daily · 2026-10-02 · Intraday — today’s close is not known yet
Can I stay long, or should I get out?
Now at 7,731, -0.87% below the recent high. From here history says 84% of the time there is no deeper break and 87% of the time it regains the high within 20 sessions — but only 53% add another 2%, against a usual 65%. Compressed both ways. Every probability comes from 2,789 comparable positions since 2005, not from an opinion.
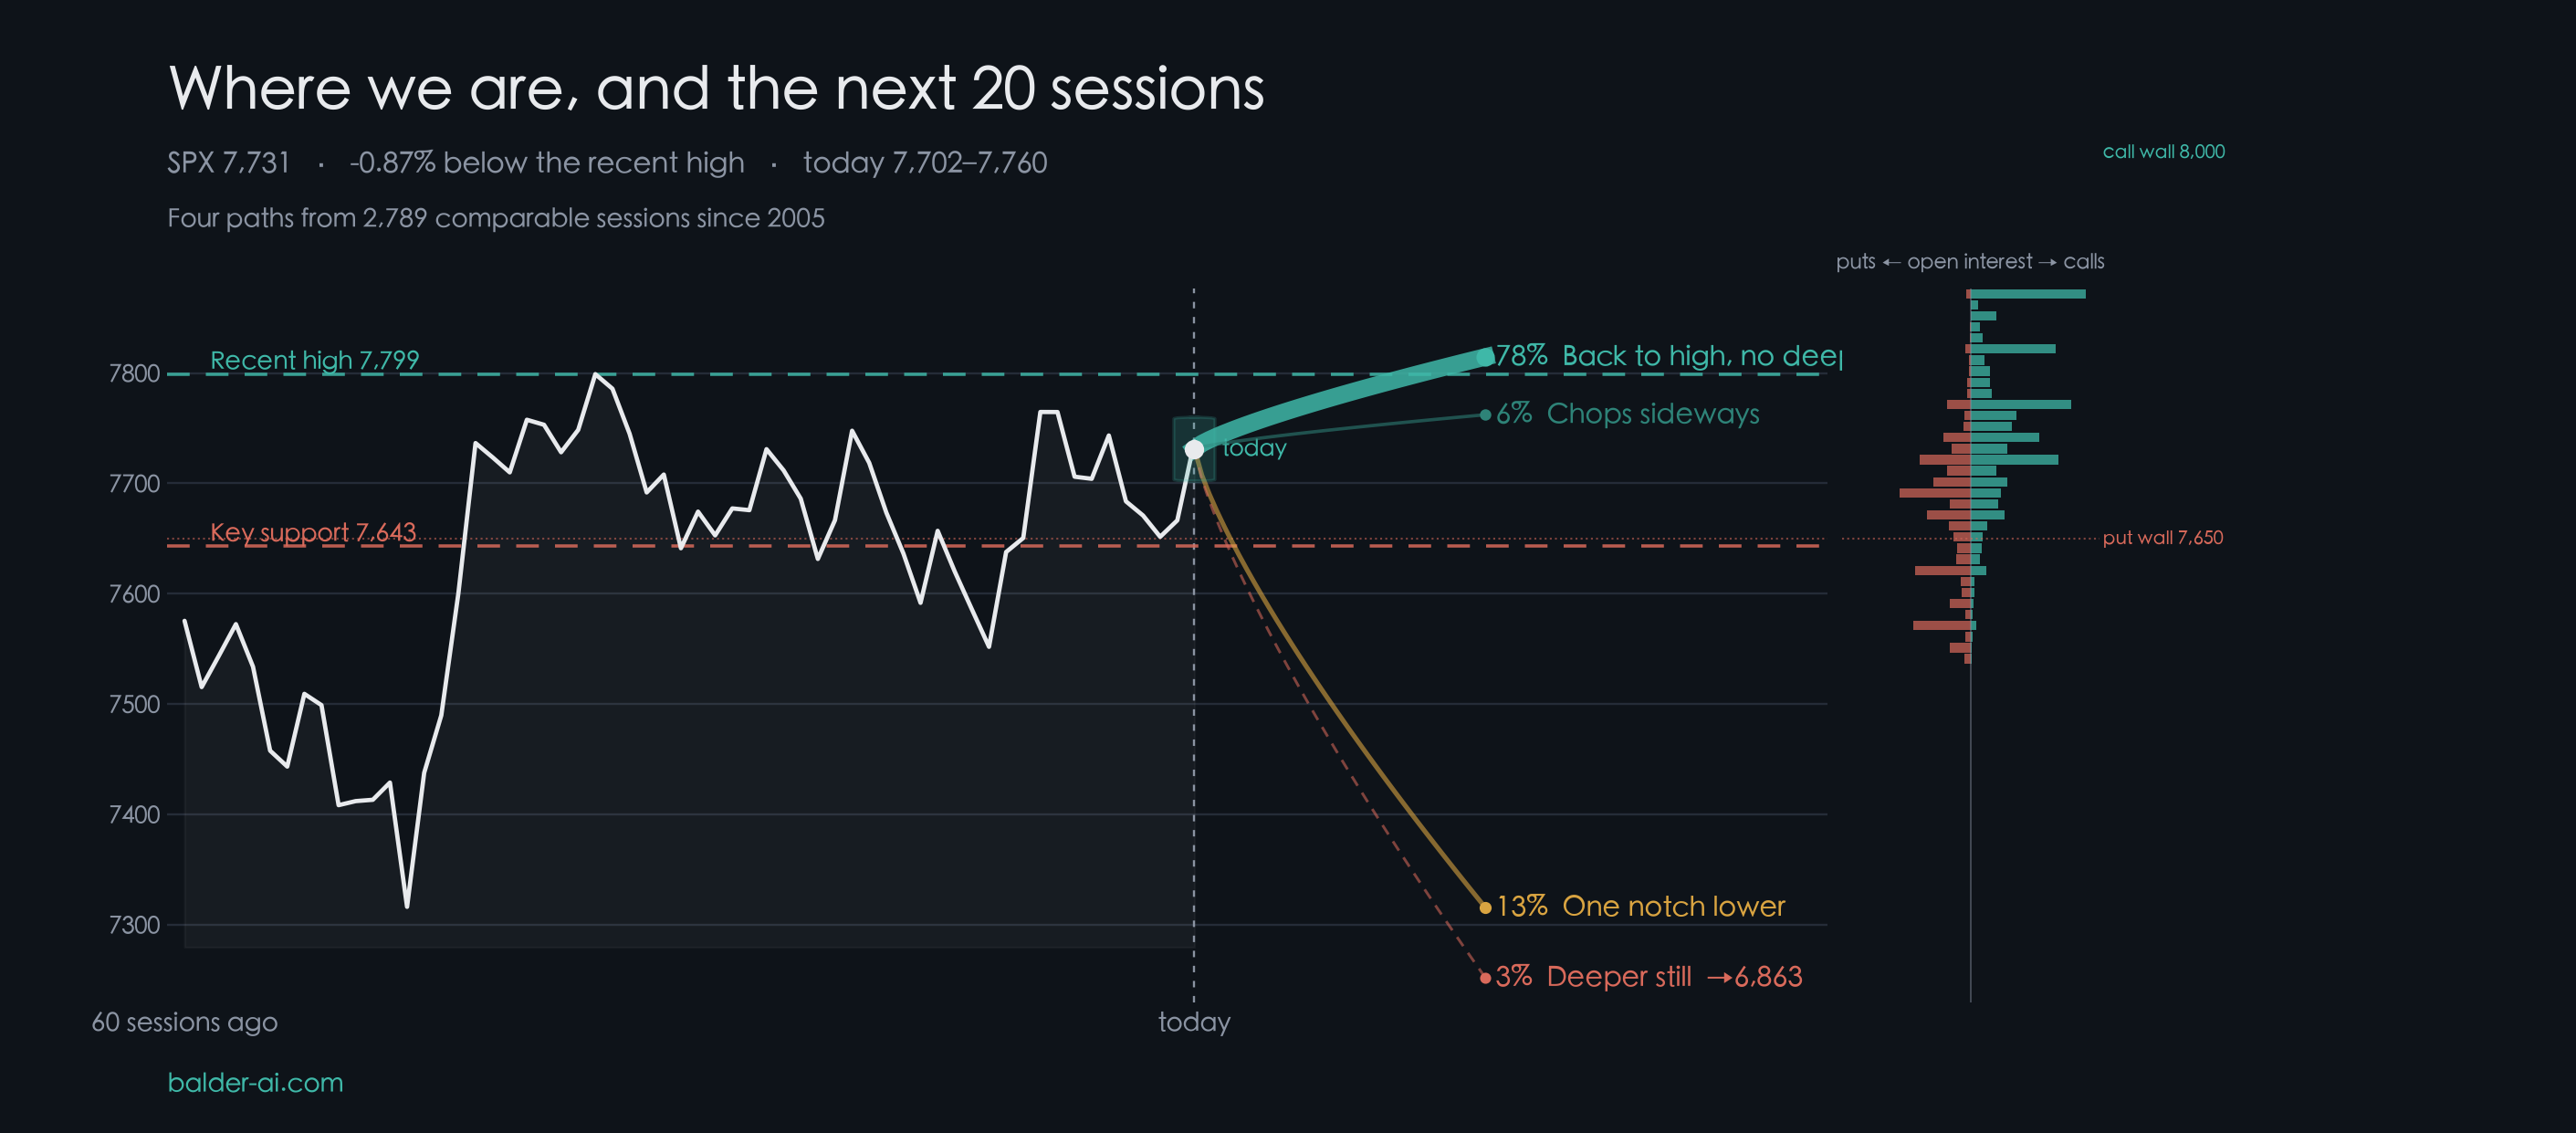
Four paths over the next 20 sessions
| Path | Probability | Deepest drawdown |
|---|---|---|
| Back to the high without a deeper break | 78% | -1.7% |
| Chops sideways, no deeper break | 6% | — |
| One notch lower (−5% to −10%) | 13% | -6.2% |
| Deeper still (below −10%) | 3% | -12.0% |
Levels that matter
| Recent high (only a return here counts as a turn) | 7,799 |
| Key support (a break drops it a notch) | 7,643 |
Today’s intraday structure
A second lens, from options open interest: which levels sit near price today. The sections above ask a different question — what happens over the next 20 sessions from here. Both use the same range, so they do not disagree. Today: Negative gamma — dealer hedging amplifies moves.
| Call wall (resistance from call open interest) | 8,000 |
| Gamma flip (above it dealers damp, below they amplify) | 7,682 |
| Put wall (support from put open interest) | 7,650 |
Method and evidence
1. We do not forecast a price, because price is a martingale
We smoothed the morning session every way we could — 3, 6 and 12-bar averages, the full morning mean, VWAP, the open, yesterday's close: ten estimators in all — and used each to guess the close. <b>The more we smoothed, the worse it got, without a single exception.</b> The best estimator was the current price itself. That is not a tuning failure. It is what Samuelson (1965) proved: in a functioning market the price already embeds what is known, so the best forecast of the next price is this one. Every smoothing throws away the newest and most relevant information. <b>What it means for you</b>: anyone handing you a specific closing level is either guessing or selling you something they know loses to the current quote. We give a range, not a point.
2. Why the range is 0.65 sigma, not the textbook 1.96
A 95% band is ±1.96 standard deviations, and nearly every tool draws it that way. But that standard deviation comes from option-implied volatility, and <b>implied volatility sits systematically above realised volatility</b> — the variance risk premium, which is what the market pays for insurance. Measured over 5,421 sessions since 2005, the median realised move is 0.54 times the implied one. A 1.96 band is therefore roughly <b>three times too wide — almost never wrong, and so carrying no information</b>. That ratio also drifts with the volatility regime, so we do not hard-code it: each day uses the median of the last 252 sessions. Across 5,189 days of true out-of-sample testing that lands at 50.4% coverage — half right, half wrong, which is the point. <b>What it means for you</b>: a range that never misses is not skill, it is filler. Ask whether it has ever been wrong.
3. Why we stop at 20 sessions and never quote 60
A 60-day forward return computed on daily data shares 59 days with its neighbour. What looks like 5,362 observations is <b>about 89 independent ones</b>, and the t-statistic is inflated by roughly 7.7x — exactly the square root of 60. This is the overlapping-sample problem Hansen-Hodrick and Newey-West exist to handle. We walked into it ourselves: a signal printed t = 5.5 at 60 days and looked untouchable; recomputed on non-overlapping windows it had 18 samples and nothing left. <b>What it means for you</b>: when someone shows a beautiful long-horizon t-statistic, ask how they handled overlap. Most have not, so most long-horizon claims run 2 to 8 times too high.
4. We throw away more than we keep
Scanning a batch of indicators and reporting the best one is this industry's most common self-deception, because <b>the search itself manufactures winners</b>: across 60 cells the best t will look high even when the data is pure noise. The fix is to block-shuffle the return series, re-run the entire search, and see how high noise alone can push it. We did that for the volatility family: the best real t was 5.67 — and <b>the median of the noise was also 5.67</b>, empirical p = 0.50. The whole family was cut. <b>What it means for you</b>: 'we tested 50 indicators and this one was best' is itself the warning label.
5. Drawdowns do not mean-revert quickly
Across 5,303 sessions, the chance of regaining the recent high within 20 sessions: 57% just off the high, 30% once 2–5% down, 7% once 5–10% down, and <b>0% below 10% — 529 samples, not one recovery</b>. That is the opposite of the buy-the-dip reflex. Depth carries momentum; it is not a spring. <b>What it means for you</b>: −5% is a level to reduce at, not to buy. The right moment to add is the next one.
6. The one signal that makes us say 'add'
Bollerslev, Tauchen and Zhou showed in the *Review of Financial Studies* (2009) that <b>implied minus realised variance</b> — the variance risk premium — predicts future equity returns, and dominates the price-earnings ratio, dividend yield and term spread. High premium, high subsequent return. On non-overlapping 20-day windows the top quintile returns 1.65% against a 0.79% baseline, t = 2.70, on 54 independent samples. <b>What it means for you</b>: the more the market pays for insurance, the better the forward return. Fear is the fuel. It is the only condition under which we say to add.
7. Finally: very little is forecastable
Using every input we can get — implied volatility, realised volatility at several horizons, the morning's own volatility, the at-the-money straddle — the explanatory power (R²) for the rest of the session is <b>0.113</b>. About <b>89% is unforecastable</b>. The index travels 27.4 points on average from late morning to the close, and most of those points are not computable by anyone. <b>What it means for you</b>: this is why we talk about probabilities and levels rather than targets and direction. Someone claiming to call direction has either not run this calculation, or has run it and not told you.
What we left out today
Some of what we compute each day fails its own threshold — too wide to be informative, too close to the base rate to act on, or simply a coin flip. Those are dropped, and listed here. A product that only shows you its hits gives you no way to tell when it is padding.
- a 2% drop probability that beat its base rate by too little to act on
- key
- the volatility risk premium — mid-range today, so it says nothing
Research record, not investment advice. Probabilities are conditional frequencies from comparable historical positions, not guarantees about the future.
Home/Products/Tech Risk Playbook
Daily · 2026-10-02 · Intraday — today’s close is not known yet
Can I stay long, or should I get out?
Now at 30,941, 0.00% below the recent high. From here history says 77% of the time there is no deeper break and 90% of the time it regains the high within 20 sessions — but only 67% add another 2%, against a usual 74%. Compressed both ways. Every probability comes from 2,323 comparable positions since 2005, not from an opinion.
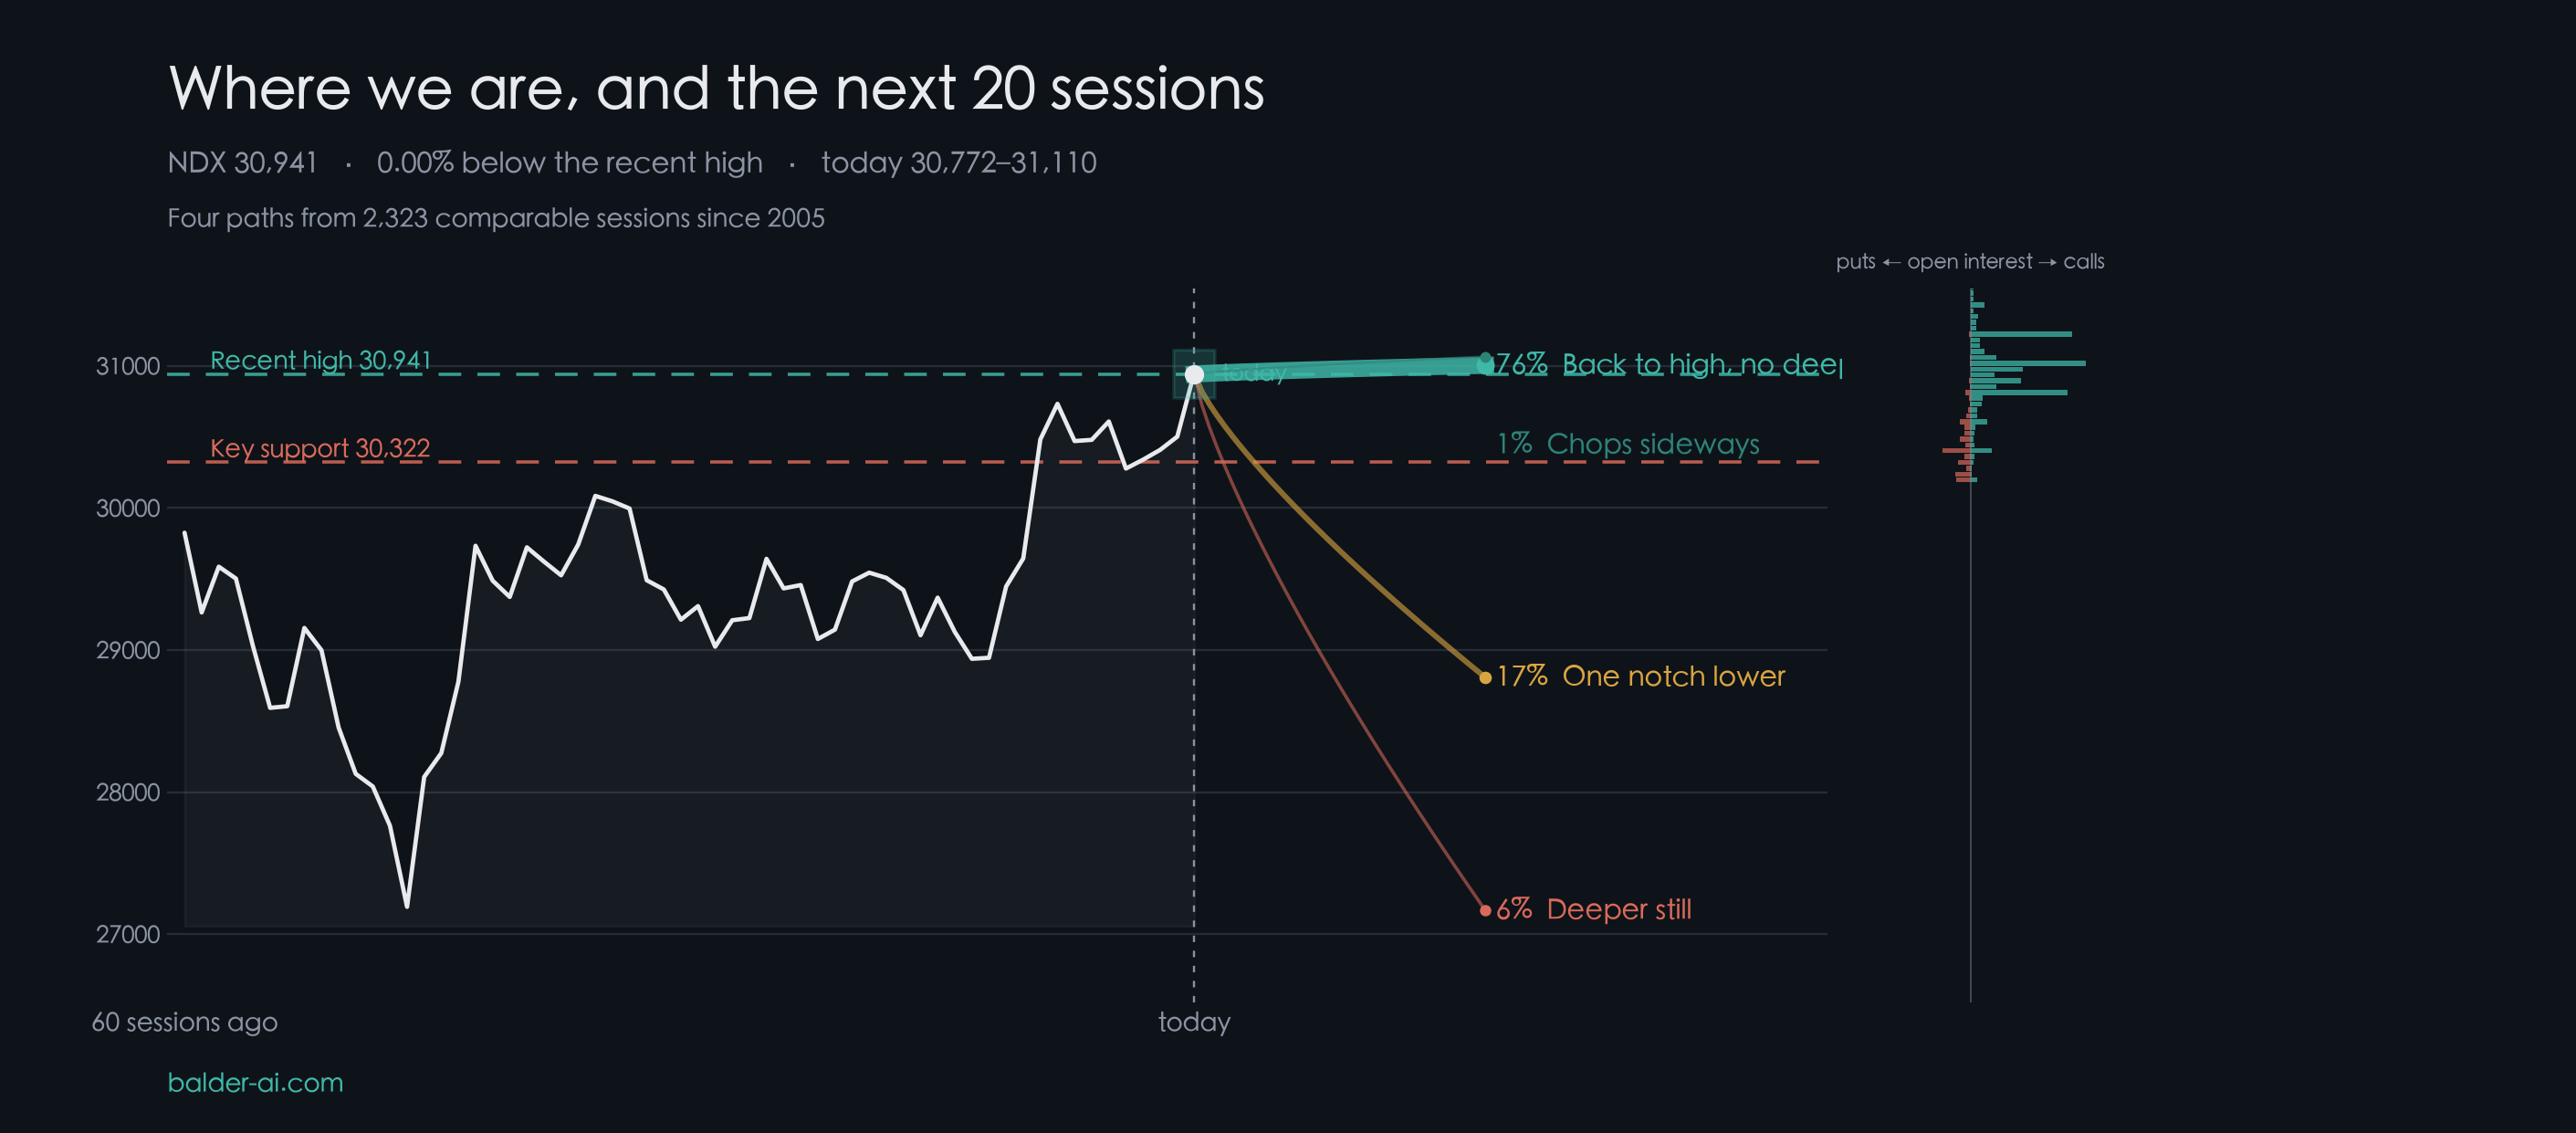
Four paths over the next 20 sessions
| Path | Probability | Deepest drawdown |
|---|---|---|
| Back to the high without a deeper break | 76% | -2.1% |
| Chops sideways, no deeper break | 1% | — |
| One notch lower (−5% to −10%) | 17% | -6.9% |
| Deeper still (below −10%) | 6% | -12.2% |
Levels that matter
| Recent high (only a return here counts as a turn) | 30,941 |
| Key support (a break drops it a notch) | 30,322 |
Method and evidence
1. We do not forecast a price, because price is a martingale
We smoothed the morning session every way we could — 3, 6 and 12-bar averages, the full morning mean, VWAP, the open, yesterday's close: ten estimators in all — and used each to guess the close. <b>The more we smoothed, the worse it got, without a single exception.</b> The best estimator was the current price itself. That is not a tuning failure. It is what Samuelson (1965) proved: in a functioning market the price already embeds what is known, so the best forecast of the next price is this one. Every smoothing throws away the newest and most relevant information. <b>What it means for you</b>: anyone handing you a specific closing level is either guessing or selling you something they know loses to the current quote. We give a range, not a point.
2. Why the range is 0.65 sigma, not the textbook 1.96
A 95% band is ±1.96 standard deviations, and nearly every tool draws it that way. But that standard deviation comes from option-implied volatility, and <b>implied volatility sits systematically above realised volatility</b> — the variance risk premium, which is what the market pays for insurance. Measured over 5,421 sessions since 2005, the median realised move is 0.54 times the implied one. A 1.96 band is therefore roughly <b>three times too wide — almost never wrong, and so carrying no information</b>. That ratio also drifts with the volatility regime, so we do not hard-code it: each day uses the median of the last 252 sessions. Across 5,189 days of true out-of-sample testing that lands at 50.4% coverage — half right, half wrong, which is the point. <b>What it means for you</b>: a range that never misses is not skill, it is filler. Ask whether it has ever been wrong.
3. Why we stop at 20 sessions and never quote 60
A 60-day forward return computed on daily data shares 59 days with its neighbour. What looks like 5,362 observations is <b>about 89 independent ones</b>, and the t-statistic is inflated by roughly 7.7x — exactly the square root of 60. This is the overlapping-sample problem Hansen-Hodrick and Newey-West exist to handle. We walked into it ourselves: a signal printed t = 5.5 at 60 days and looked untouchable; recomputed on non-overlapping windows it had 18 samples and nothing left. <b>What it means for you</b>: when someone shows a beautiful long-horizon t-statistic, ask how they handled overlap. Most have not, so most long-horizon claims run 2 to 8 times too high.
4. We throw away more than we keep
Scanning a batch of indicators and reporting the best one is this industry's most common self-deception, because <b>the search itself manufactures winners</b>: across 60 cells the best t will look high even when the data is pure noise. The fix is to block-shuffle the return series, re-run the entire search, and see how high noise alone can push it. We did that for the volatility family: the best real t was 5.67 — and <b>the median of the noise was also 5.67</b>, empirical p = 0.50. The whole family was cut. <b>What it means for you</b>: 'we tested 50 indicators and this one was best' is itself the warning label.
5. Drawdowns do not mean-revert quickly
Across 5,303 sessions, the chance of regaining the recent high within 20 sessions: 57% just off the high, 30% once 2–5% down, 7% once 5–10% down, and <b>0% below 10% — 529 samples, not one recovery</b>. That is the opposite of the buy-the-dip reflex. Depth carries momentum; it is not a spring. <b>What it means for you</b>: −5% is a level to reduce at, not to buy. The right moment to add is the next one.
6. The one signal that makes us say 'add'
Bollerslev, Tauchen and Zhou showed in the *Review of Financial Studies* (2009) that <b>implied minus realised variance</b> — the variance risk premium — predicts future equity returns, and dominates the price-earnings ratio, dividend yield and term spread. High premium, high subsequent return. On non-overlapping 20-day windows the top quintile returns 1.65% against a 0.79% baseline, t = 2.70, on 54 independent samples. <b>What it means for you</b>: the more the market pays for insurance, the better the forward return. Fear is the fuel. It is the only condition under which we say to add.
7. Finally: very little is forecastable
Using every input we can get — implied volatility, realised volatility at several horizons, the morning's own volatility, the at-the-money straddle — the explanatory power (R²) for the rest of the session is <b>0.113</b>. About <b>89% is unforecastable</b>. The index travels 27.4 points on average from late morning to the close, and most of those points are not computable by anyone. <b>What it means for you</b>: this is why we talk about probabilities and levels rather than targets and direction. Someone claiming to call direction has either not run this calculation, or has run it and not told you.
What we left out today
Some of what we compute each day fails its own threshold — too wide to be informative, too close to the base rate to act on, or simply a coin flip. Those are dropped, and listed here. A product that only shows you its hits gives you no way to tell when it is padding.
- a 2% drop probability that beat its base rate by too little to act on
- key
- up2
Research record, not investment advice. Probabilities are conditional frequencies from comparable historical positions, not guarantees about the future.
Earnings Radar
What the option market charges vs what the stock does
Published every Sunday for the week ahead. For each name reporting, the board compares the implied move priced into options against the typical move that stock has actually delivered on its last nine reports. When those two disagree, that is the trade.
This week's board
Live predictions for the coming week, published before the reports. Verdict is the ratio of implied to typical: RICH means options cost more than the stock usually moves, CHEAP means less.
| Symbol | Reports | Session | Implied | Typical | Verdict | Up-rate | Window |
|---|---|---|---|---|---|---|---|
| MU | 09-30 | post | 8.6% | 8.8% | FAIR 0.98× | 33% | this week |
| JPM | 10-13 | pre | 5.3% | 2.4% | RICH 2.17× | 44% | next 2wk |
| GS | 10-13 | pre | 6.6% | 3.2% | RICH 2.06× | 67% | next 2wk |
| UNH | 10-13 | pre | 8.6% | 8.7% | FAIR 0.99× | 44% | next 2wk |
| MS | 10-14 | pre | 6.6% | 3.3% | RICH 2.02× | 89% | next 2wk |
Previous predictions, scored
On every card the conclusion sits in the top-right badge — that is the whole read, and it comes in three colours: ■ green BULLISH means the model expects up, ■ red BEARISH expects down, and ■ grey coin-flip means it has no edge and makes no call at all.
Only the red and green calls are counted below — the same threshold the card itself uses to print the badge, so the table can never disagree with the picture. The grey ones are not predictions and are excluded rather than quietly scored as free wins — a call the model declined to make cannot be right or wrong. Click any row to see the original card exactly as it was posted on X, before the report.
| Symbol | Reported | Session | Our call | Expected | Actual | Result | |
|---|---|---|---|---|---|---|---|
| DELL | 09-01 | post | BULLISH | ±9.7% | +15.8% | hit | card → |
| MRVL | 08-27 | post | BULLISH | ±11.7% | -10.3% | miss | card → |
| CRWD | 08-26 | post | BULLISH | ±6.8% | +20.5% | hit | card → |
| WMT | 08-20 | pre | BULLISH | ±5.0% | -9.2% | miss | card → |
| LOW | 08-19 | pre | BULLISH | ±3.5% | +2.0% | hit | card → |
| CSCO | 08-12 | post | BEARISH | ±7.2% | -8.4% | hit | card → |
| LITE | 08-11 | post | BULLISH | ±9.1% | +13.6% | hit | card → |
| ASTS | 08-10 | post | BULLISH | ±11.0% | +4.2% | hit | card → |
| RKLB | 08-10 | post | BEARISH | ±10.9% | -0.0% | hit | card → |
| QBTS | 08-06 | pre | BULLISH | ±8.6% | -9.3% | miss | card → |
| RGTI | 08-06 | post | BULLISH | ±7.6% | +8.5% | hit | card → |
| CRCL | 08-05 | pre | BULLISH | ±9.5% | +0.1% | hit | card → |
| UBER | 08-05 | pre | BULLISH | ±5.0% | -5.3% | miss | card → |
| IONQ | 08-05 | post | BULLISH | ±10.2% | -0.5% | miss | card → |
| OXY | 08-05 | post | BULLISH | ±4.6% | +4.1% | hit | card → |
| AMD | 08-04 | post | BULLISH | ±7.6% | -7.0% | miss | card → |
| CVX | 07-31 | pre | BEARISH | ±2.1% | +2.4% | miss | card → |
| MA | 07-30 | pre | BULLISH | ±2.4% | +2.5% | hit | card → |
| AMZN | 07-30 | post | BULLISH | ±6.7% | +15.3% | hit | card → |
| MSFT | 07-29 | post | BULLISH | ±6.1% | +15.5% | hit | card → |
| BA | 07-28 | pre | BULLISH | ±4.0% | +4.8% | hit | card → |
| STX | 07-28 | post | BULLISH | ±12.5% | +2.3% | hit | card → |
| INTC | 07-23 | post | BEARISH | ±10.4% | -7.9% | hit | card → |
| TSLA | 07-22 | post | BEARISH | ±5.2% | -14.5% | hit | card → |
| TSM | 07-16 | pre | BULLISH | ±3.4% | -2.3% | miss | card → |
| NFLX | 07-16 | post | BEARISH | ±8.1% | -7.3% | hit | card → |
| MS | 07-15 | pre | BULLISH | ±3.1% | +0.4% | hit | card → |
How it's built
- Implied — the at-the-money straddle on the first expiry after the report, over spot. That is literally what the market charges you to own the move.
- Typical — mean absolute reaction across the last 9 prints, from the tape.
- Session alignment — a pre-market report moves the stock that day; an after-close report moves it the next. Measure both the same way and a fairly-priced option looks 4× too expensive. Most sources do exactly that.
- Silent weeks — if fewer than two covered names report, no board is published rather than padding one out.
Structure Read
The chart the desk actually trades from
Not a price line. Zig-zag pivots, the break triggers on both sides, measured targets, the volume-at-price magnet profile on the right edge, and the read written out underneath. All 103 covered tickers are searchable, and every one of them gets the full desk chart.
Browse all 103 tickers
Event tracker
Catalysts, tracked to the day
Dated events that can reprice a name in one session — court dates, regulatory decisions, rulings. For each one: the docket, what is actually at stake, and what the tape has done since it opened, measured against the market so you see the part that is not the market.
Meta child-safety trial — the states' case
The states' case is over. On 2026-08-26 the jury trial completed and Judge Gonzalez Rogers entered a consent judgment between Meta and the state attorneys general, with a settlement agreement attached. MDL 3047 itself continues — the personal-injury bellwethers are still live and new short-form complaints were filed two days later.
What is at stake
How it got here
Why it moves the tape
The gap between the two sides is five orders of magnitude, and the number is not set by a jury. Eight jurors answer factual questions in an advisory capacity; Judge Gonzalez Rogers decides liability and any penalty herself. That removes the usual jury-verdict anchor and makes the outcome harder to price — which is why the tape is moving on testimony rather than waiting for a number.
The comparable everyone is citing
On 2025-09-03 Alphabet closed +9.14% the day Judge Mehta's remedies ruling landed in the search antitrust case — Google kept Chrome and Android, and roughly $234B of value came back in a session. The read being drawn is that for a mega-cap the RESOLUTION is the event, not the testimony: the overhang prices in on the way down, and it unwinds in one move.
+9.14% is measured from our own daily bars (211.35 -> 230.66), not quoted from a headline.
- Different posture. Mehta's was a REMEDIES ruling after liability was already decided; this trial decides liability and penalty together.
- Different mechanism. Alphabet re-rated because a feared structural remedy — divestiture — was taken off the table. The analogous relief here is injunctive: forced changes to Instagram's teen product.
- A settlement is not a ruling. Snap and TikTok settled on confidential terms, which produces no public number to re-rate against.
- The direction is not symmetric. Google's move was up because the outcome was milder than priced; the same logic cuts the other way if a penalty lands above what is priced.
What we are watching
- The states' case is done. What is still open is MDL 3047 itself: the Breathitt, Tucson and Charleston bellwethers, and a docket that took seven new complaints two days after the consent judgment.
- The settlement agreement is an attachment to Dkt 3451. Terms are in that document, not in the docket text, so any figure quoted without reading it should be treated as hearsay.
How this is tracked
- resolved by consent judgment 2026-08-26 — the states' case is finished
- MDL 3047 personal-injury bellwethers continue on their own schedule
A catalyst has to name a source that can be polled, a thing to look for in it, and a set of outcomes it can land on. Without those three it is a news topic, and the build refuses to publish it as an event.
Facts only — this is a record of a docket and of what the tape did, not a prediction and not investment advice.
Google ad tech — the remedy ruling
Liability is already decided. What is outstanding is the remedy: divest AdX, or conduct rules only.
What is at stake
How it got here
Why it moves the tape
The overhang is priced against an unknown remedy, and the range is structural-to-cosmetic. Because liability is settled, this is the narrower question of what Google must give up — which is exactly the shape of the September 2025 search remedy, where the stock re-rated in one session once divestiture came off the table.
What we are watching
- There is no scheduled date. The signal is the docket going from housekeeping to an ORDER or OPINION.
- Brinkema questioned whether a buyer for AdX even exists, and how long customer migration would take.
- An appeal would extend the overhang rather than end it, whichever way it lands.
How this is tracked
- structural: AdX divested, DFP possibly to follow
- conduct only: interoperability, no preferential treatment, a monitor
- a mix, with divestiture held in reserve
A catalyst has to name a source that can be polled, a thing to look for in it, and a set of outcomes it can land on. Without those three it is a news topic, and the build refuses to publish it as an event.
Facts only — this is a record of a docket and of what the tape did, not a prediction and not investment advice.
Moderna / Merck melanoma readout — the case for tracking trials
The first positive Phase 3 for an mRNA cancer therapy. MRNA doubled; its partner MRK, a $380B company, moved 12% on someone else's trial.
The tickers that moved with it
A catalyst is rarely one ticker. Partners, sponsors and platform peers reprice on the same news, and the partner move is the one nobody screens for.
What is at stake
How it got here
Why it moves the tape
This is the template, and it contains the trap. The trial is SPONSORED BY MERCK — Moderna appears only as a collaborator. Screen lead sponsors alone and you tag this MRK and miss the stock that doubled. The readout also landed three years before the listed primary completion date, on an interim analysis, so that date is a floor for the search rather than the event itself. Both lessons are now built into how the screen works.
What we are watching
- A trial readout is rarely one ticker. Sponsor, collaborator and the platform's peers all reprice.
- primaryCompletionDate bounds the search; an interim analysis is what actually lands.
- The partner move is the underpriced one — MRK is followed by everyone and still moved 12% on a trial that is not its headline asset.
How this is tracked
- endpoints met — the mRNA cancer platform is validated
- endpoints missed — the platform thesis resets
- mixed or delayed — no re-rating either way
A catalyst has to name a source that can be polled, a thing to look for in it, and a set of outcomes it can land on. Without those three it is a news topic, and the build refuses to publish it as an event.
Facts only — this is a record of a docket and of what the tape did, not a prediction and not investment advice.
FDA advisory committee votes — the catalyst you can diary
Every other pharma source tells you after the fact. An advisory committee meeting is published a median 30 days before a panel votes in public, on a named product, from a named company.
What is at stake
How it got here
Why it moves the tape
Measured against this desk's own reference case, the sources everyone reaches for arrive late. ClinicalTrials.gov led the real completion date in 0 of 249 recent Phase 3 trials, median lag 478 days, and the trial behind a 150% move is still unchanged in the registry. Readout 8-Ks reach EDGAR a median 105 minutes after the day's biggest volume bar. An advisory committee notice is the exception: a public date, a named company, and a vote with a bounded outcome, published weeks ahead.
What we are watching
- The date is the signal. A notice appears, the meeting is diarised, and the position is sized before the panel sits — not after the tape has moved.
- A postponement or cancellation is news in its own right and usually reads negative for the sponsor, so the tracker alerts when the DATE changes, not only when a meeting is added.
- This covers advisory committee meetings only. Most approvals never get one, and PDUFA action dates are not published in any machine-readable form we have found.
How this is tracked
- panel votes favourable — the approval path clears and the sponsor re-rates
- panel votes against — for a single-product company this is the whole thesis
- meeting postponed or cancelled — itself tradeable, and usually reads negative
A catalyst has to name a source that can be polled, a thing to look for in it, and a set of outcomes it can land on. Without those three it is a news topic, and the build refuses to publish it as an event.
Facts only — this is a record of a docket and of what the tape did, not a prediction and not investment advice.
Research
What we actually tested
Each study below gives its method, its sample size and the null it was tested against — and the ones that failed are published the same as the ones that did not. Eight studies, newest first; open any of them for the full version.
- Each one opens with the question. What was being asked, what came back, and why it changes anything — in plain words, before any table. If you read only that, you should still know what happened.
- The failures are published too. Most of what circulates about markets is a pattern someone found after looking at a lot of patterns. A result only means something once it has been charged for the size of the search that produced it, and most do not survive that. Knowing what doesn’t work is the cheaper half of the education.
- The sample size is always stated. Nineteen midterms is nineteen observations no matter how confident the chart looks. Where the honest answer is “this cannot be tested at this sample size”, that is what gets written.
Who sells computing power to Anthropic, and who might be next?
Akamai, a bitcoin miner, a video company's cloud arm: Anthropic buys compute from an unusual list of sellers, and every announcement has moved a stock. We traced each deal to its filing, checked the popular claim that IREN signed one (it did not), and measured what the stocks did afterwards. Most of the move came at the open and faded by the close.
Read the study →When does the market actually move on a Fed day?
By half past one an ordinary trading day has already set 85% of its high and low for the session. A Fed decision day has set 49% — half the day is still ahead of it. We measured where the range actually gets made, minute by minute, in two independent samples. The morning is not just calm relative to the afternoon; it is quieter than an ordinary morning.
Read the study →Does Apple really rise before an iPhone launch?
It is one of the best-known patterns in the market: buy Apple into the September keynote, sell the news. We measured every launch, then went down to one-minute bars. The run-up is not there — and the fall is not where anyone looks for it: Apple rises during the keynote and sells off in the hour after it ends.
Read the study →Why chip stocks soared and Apple sank on the same jobs report
On 4 September a far stronger jobs number sent semiconductors up 3.5% while Apple fell 2.5% in the same session. Everyone reached for the same explanation: interest rates. We tested that against ten years of daily data — rates account for under half a percent of it.
Read the study →Is there ever a good time to buy an option?
Traders carry rules of thumb for when an option is cheap. We tested about 900 of them against 2,047,796 real trades, and none survived. The conditions that genuinely predict a big move are real — the option’s price already contains them.
Read the study →A record amount of money went into tech. Does it mean anything?
August brought the largest monthly inflow into the Nasdaq-100 ETF in 86 months, and no shortage of stories about what it signalled. Rebuilt from the fund’s own SEC filings: first by dollars, only eighth as a share of the fund — and a “net inflow” is a 2% leftover between two enormous opposing flows.
Read the study →How should you trade the midterm elections?
Thirty-four popular election trading patterns, tested one at a time. Almost every one rests on just 19 elections since 1950 — too few to tell a rule from a coincidence. One survived, and it is not a way to make money. The options market prices election night about right.
Read the study →What the big institutions actually bought, from their own filings
Not a data vendor’s summary: 1,410 institutions and 4.77 million holdings rebuilt from the raw filings they send the SEC, plus 124 companies’ own quarterly reports read line by line to trace where $100 billion of tariff refunds ended up.
Read the study →Research · 2026-08-22
27,829 real straddles, ~900 gates, none survived
Before you buy an option you want a gate — a rule that says when the option is worth owning. Every candidate gate here was tested against real traded prices: 2,047,796 daily prints on 122,551 actual contracts since February 2024, assembled into 27,829 at-the-money straddle entries across 83 names. Nothing is modelled. The answer is not the one anybody wants, which is why it is worth publishing.
Everyone who buys options has a rule for when one is cheap. Does any of those rules survive contact with real prices?
No. About 900 candidate rules were tested on 27,829 real straddles and none survived being charged for the size of the search. The states that genuinely predict movement — a quiet stock, an earnings print coming, a volume surge — are real. The option’s price already contains them.
It tells you where not to spend effort, and it puts a number on the cost most people underestimate: crossing the spread turns a 7-day straddle from +3.1% into −1.2%. Before hunting for a better signal, check whether execution has already eaten the answer.
First, the floor
Any gate has to beat doing nothing. An ungated ATM straddle held to expiry, after paying the measured half-spread:
The underlying effects are real, and large
Ten years, 83 names. Each bar measures how much a stock actually moved against what its own trailing volatility priced it to move. Every one of these is family-corrected p = 0.000. These are not noise.
Every family, charged for its own search
Search 900 cells and some will look good. So each family pays for its whole search against an empirical max-statistic null: outcomes are circularly rotated within each symbol and tenor, severing the link while preserving autocorrelation on both sides. An independent shuffle would hand every family a flatteringly tight null — this desk has already seen an observed t of +5.35 land at the 15th percentile of its own honest null.
| Family | Cells | max |t| | p | Best tradeable cell |
|---|---|---|---|---|
| market regime | 30 | 4.39 | 0.040 | driver is a negative-mean avoid cell, non-monotone |
| earnings proximity | 8 | 2.84 | 0.100 | nothing positive and significant |
| RSI | 36 | 3.37 | 0.120 | best cell in the search: +4.3% net — below every bar |
| RSI → calls | 36 | 3.35 | 0.130 | no directional signal |
| trend / uptrend | 86 | 3.64 | 0.245 | no directional signal |
| debit bound | 8 | 2.05 | 0.415 | the rule's layer 2 — inert |
| liquidity | 32 | 5.17 | 0.520 | high t, no economics |
| vol · IV pct · squeeze | 66 | 2.83 | 0.630 | the layer that works on the underlying |
- The two-layer rule, as specified: rejected. Layer 2 — “debit below a bound derived from historical moves” — barely filters anything (the Q90 bound admits 90.4% of entries) and the cheapest bucket is the worst. The flagship combination selects the identical 1,400 entries as layer 1 alone. A debit below the historical move quantile just is the market pricing low vol, and the market is mostly right.
- Layer 1 survives as a candidate, not a result. Cheap-IV entries at 30 days return +5.58% net, and it is robust — drop the best month or the best symbol and it is still +5.40%. But the win rate is 0.42, the median trade is −14.4%, 2025 was negative, and the clustered t is 1.61 against a pre-registered bar of 2.90. It is a tail premium that pays in convex bursts. Twenty-eight months cannot prove that.
- Direction is a wall of nulls. Ten years, 83 names, and not one of RSI, trend, squeeze, volume or market regime predicts drift. The idea of reading an uptrend off RSI to buy calls has nothing under it, on either ten years of underlying data or 2.6 years of real call prices.
Research · 2026-08-21
Midterms 2026 — 34 claims tested, one survived
Almost every midterm “pattern” rests on 19 observations since 1950, with overlapping windows, selected after the fact. Each was tested against an empirical null. The negative results are published here as results.
An election is a scheduled event with a binary outcome. How do you prepare for one, and is there a way to be paid whoever wins?
Almost every published midterm pattern rests on 19 observations since 1950 and does not survive a proper null. The option market prices election night at roughly fair value, and the one regularity strong enough to survive is political rather than financial.
It saves you from positioning on folklore, and it teaches the difference between a pattern that is real and one that is tradeable. The president’s party losing House seats is extremely reliable — and tells you almost nothing about prices.
The one that survived
The president’s party has lost House seats in 17 of 19 midterms since 1950 — mean loss 24 seats, median 18. It lost at least the five seats Democrats need in 2026 in 16 of 19, a base rate of 0.842 with a 95% interval of 0.64 to 0.95. Binomial p = 0.00036. The only exceptions are 1998 and 2002.
What the market has already priced
SPX has listed expiries on 2026-11-03 (election day) and 11-04 — CBOE special-listed the pair long before the ordinary daily rollout reached them. That makes the event priceable to the day. Backing the incremental variance out of adjacent expiries:
Election night is priced at 1.091% — 1.17× an ordinary session. The entire event premium is worth 1.60 SPX points, about $160 on the ATM straddle. Against 19 midterms of realised result-day moves: RMS 1.384%, median just 0.700%, and the implied sits comfortably inside the bootstrap interval. Drop the single 1982 observation and realised RMS falls to 1.097% — which is the price. The market is charging roughly fair.
What did not survive
Each tested against a matched non-election baseline rather than against zero, with max-statistic correction wherever windows, sectors or thresholds were swept.
| Claim | n | What the data says | Verdict |
|---|---|---|---|
| Result day is a big move | 19 | 0.94× an ordinary day; 0.55× since 1986 | p=0.26 |
| Markets rally after midterms | 24 | +13.13% vs +8.20% unconditional | p=0.163 |
| Positive 12 months, 19 of 19 | 19 | true — but August is also 19/19, mean 16.6% | year, not event |
| Weak Oct, strong Nov–Dec | 19 v 57 | Nov–Dec is the ordinary year-end seasonal | p=0.87 |
| Vol rises into the election | 19 v 57 | 1.11× vs 1.01×, after correcting the search | p=0.617 |
| Divided government pays | 5 v 14 | −0.44pp; anything under 9pp is invisible | p=0.93 |
| Sectors price the outcome | 13 | best of 54 cells, family-wise corrected | p=0.625 |
| Same outcome, same reaction | 2 | 10 of 16 sleeves agreed; healthcare flipped | p=0.454 |
| A run-up into the vote | 19 | +2.20% vs +1.62% for random 74-day windows | p=0.72 |
| Senate has a base rate too | 19 | president's party lost 4+ seats in 9 of 19 | p=0.143 |
- Midterms are not presidential elections. The result-day move is 0.94× an ordinary day and 0.55× since 1986. Presidential election days run 1.89×, p = 0.0001. Reasoning from 2016 or 2020 to 2026 imports the wrong base rate.
- The 12-month record is a year, not an event. 19 of 19 positive is true and survives a block bootstrap — but an August anchor in the same years is also 19/19 with a higher mean (16.6% vs 14.1%), and October’s mean is higher still. The election is not doing the work.
- Rich or cheap is unknowable. The buyer’s edge is +0.11% of index with a 95% interval of [−0.27%, +0.57%]. Resolving an edge that size at midterm frequency would take roughly 2,370 years.
The dated sequence
This desk only tracks catalysts with a date on them. Everything scheduled between today and the seating of the next Congress. Bold entries are hard dates.
| Date | Event |
|---|---|
| Sep 11 | CPI, August |
| Sep 15 | Delaware — the last primary of the cycle |
| Sep 15–16 | FOMC with dot plot |
| Sep 18 | first general-election ballots: ID, MN, SD, VA |
| Oct 2 | Employment Situation — last jobs report before the vote |
| Oct 14 | CPI — last inflation print before the vote |
| Oct 15 | North Carolina early voting; most states follow |
| Oct 28 | FOMC decision 14:00 ET — six days out |
| Nov 3 | ELECTION DAY. SPXW expiry settles 16:00 ET, polls still open |
| Nov 4 | SPXW expiry — the only listed instrument spanning the night |
| Nov 6 | Employment Situation, October |
| Nov 20 | SPX monthly |
| Dec 1 | Georgia Senate runoff if nobody clears 50% — Ossoff's seat |
| Dec 8–9 | FOMC |
| Jan 3 | the 120th Congress convenes |
- The December 1 Georgia runoff is a live 28-day path to the Senate being unresolved. Georgia requires a majority; the seat up is Ossoff’s. It went to a runoff in 2008, twice in 2020, and again in 2022. Louisiana, which supplied December runoffs in past cycles, has closed that path for 2026 — so Georgia is now the single named mechanism.
- Resolution timing has no usable base rate. Only one modern midterm has been both close and counted under mass mail voting. That is n = 1, and no distribution can be built from it.
- The November SPX dailies are not listed yet. There is currently nothing between Nov 4 and Nov 20, and the dense-listing horizon runs about six weeks — so they should appear in early October. That is itself a dated item.
Research · 2026-08-22
The record QQQ inflow, and whether it is an election bet
A Koyfin chart is circulating showing a $10.91B monthly QQQ inflow — the tallest bar on it — narrated as money arriving to bet on the midterms. The flow series was rebuilt from 27 SEC N-PORT filings, which report creations and redemptions directly, so no vendor number had to be taken on trust. It reproduces every prior month to three decimals.
A chart showing a record $10.91B monthly inflow into QQQ went around with the claim that money is arriving to bet on the midterms. Is the number real, and is the reason?
The inflow is real. The record is mostly fund growth — first of 86 months in dollars, eighth as a share of assets. The election attribution cannot be tested on one prior midterm, and the single comparable window ran outflows.
It shows how to read any flow headline: normalise by fund size, check the month is even finished, and remember a net flow is a ~2% residual between two enormous legs. Flows chase returns far more reliably than they anticipate events.
- The direction is right — it is an inflow. About $9.5–9.7B so far, on 15 of the month’s 21 sessions, against start-of-month assets of $459.1B. Pro-rated, roughly $13.3B. A story claiming it was a $10.9B outflow is circulating too; it names no source and cannot decide whether the fund holds $450B or $488B.
- Half the record is an illusion of size. In dollars it is first of 86 months — by $39M, a 0.41% margin, well inside measurement error, and two share-count vendors disagree by $1.6B. As a percent of assets it is 8th of 86. QQQ has grown from $73B to $459B; dollar records are close to automatic.
- The election part is untestable. The reconstructed series holds one prior midterm. In it, the pre-election Aug–Oct window ran outflows averaging −0.41% of assets a month against +0.69% for every other month, and August 2022 itself was a −$1.03B outflow. At n=1 the smallest detectable effect is 7.2× the average month — so this is underpowered, not a clean negative. Either way there is no precedent supporting the story.
Research
Institutional flow · Q2 2026
Rebuilt from SEC's raw 13F filings rather than a vendor feed. Net flow is change in share count × quarter-end price — change in reported value just tells you the stock went up.
Vendors sell you a processed version of what companies file. What do you see if you read the filings themselves?
Different numbers. Net flow computed from share counts rather than reported value, manager re-registrations excluded, and 124 companies’ own 10-Qs read to find where $100B of struck-down tariff refunds actually landed.
The primary record is public, free, and is where the vendor’s answer came from in the first place. Reading it yourself is the cheapest edge available, and the fastest way to learn what the data actually contains.
- Splits restated from the holders themselves, not a data feed.
- Entity migration excluded — a manager re-registering is not buying.
- CUSIP changes and share classes netted by issuer.
- Misreported rows dropped against the filers' own consensus price.
Filing dredge · who got the $100B
SEC filings are the original record, public before anyone writes them up. This study read 124 companies' own 10-Qs to find where the struck-down tariff refunds actually landed.
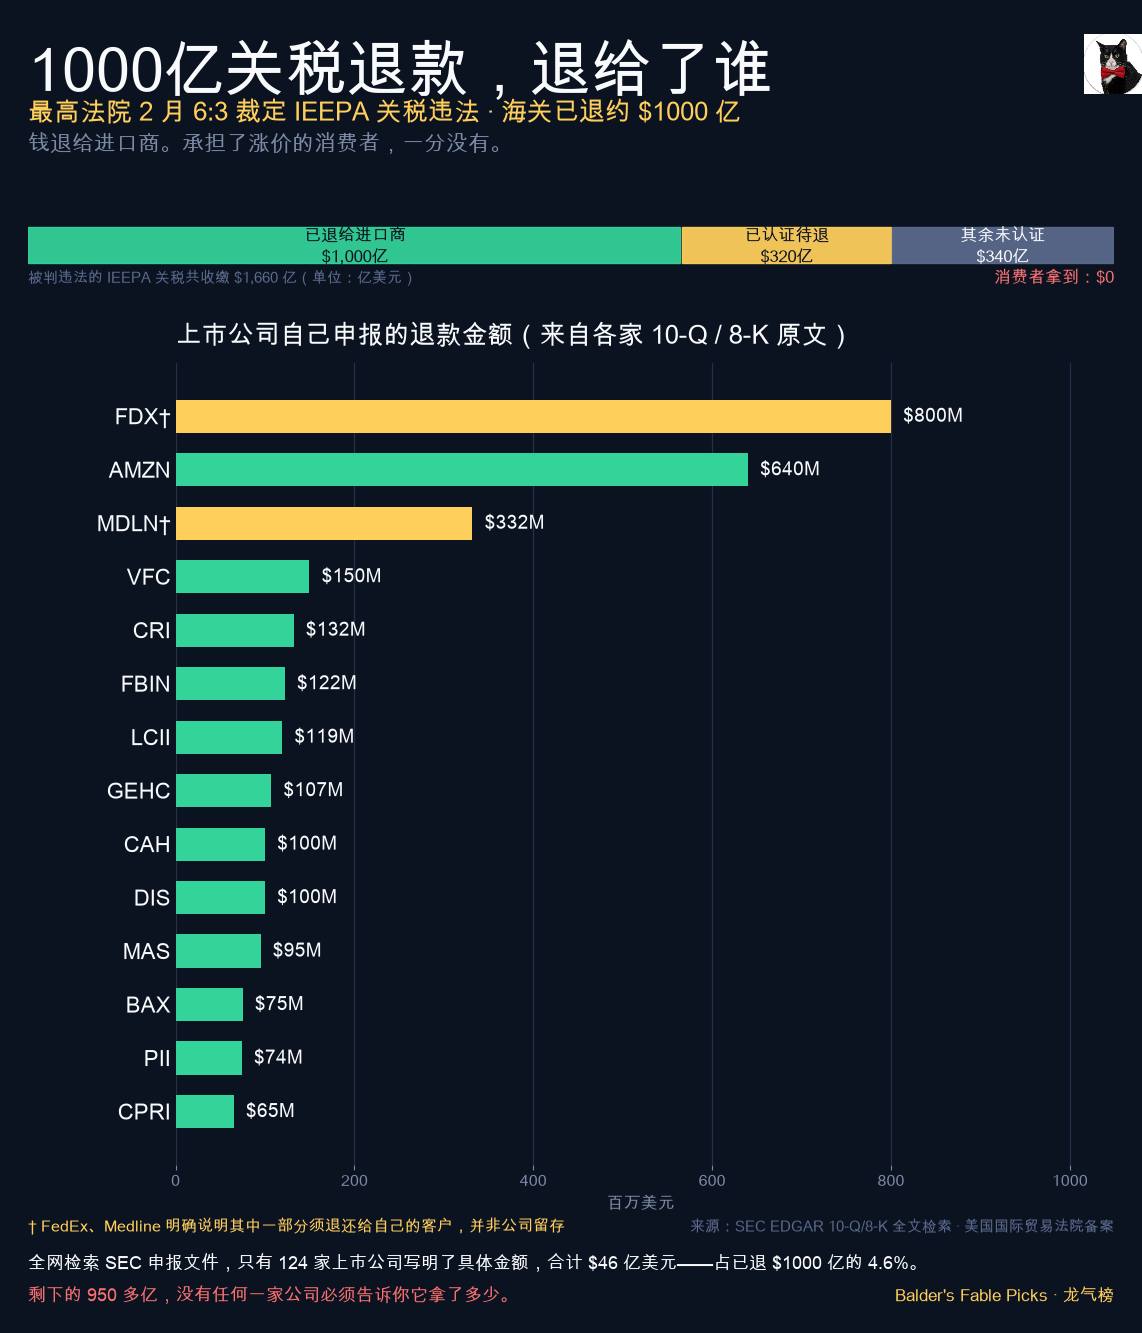
- Form 4, code P only — an open-market purchase with the insider's own cash. Grants, option exercises and scheduled 10b5-1 sales say nothing about conviction.
- Schedule 13D — somebody crossing 5% with intent to influence.
- Scanned twice a day, straight from EDGAR full-text.
Research · 2026-09-04
Why chip stocks soared and Apple sank on the same jobs report
Almost everyone gave the same answer: interest rates. Tested against ten years of daily data, rates account for 0.46% of the split.
August payrolls came in at +162,000 against a consensus near +53,000. That day semiconductors rose 3.52% while Apple fell 2.51%, Microsoft 2.04% and Tesla 5.92%. Every account of the session assumed the same causal chain: hot data → higher rate expectations → long-duration megacap sold, cyclical semis bought. That chain was tested against 2,683 sessions. It does not hold.
When a jobs number surprises and technology splits in half the same day, everyone reaches for the same explanation: rates moved, so long-duration stocks got repriced. Does the rate move actually explain the split?
No, and not marginally. Regress daily semis-minus-megacap dispersion on the daily change in all four Treasury tenors across ten years and the R-squared is 0.0046 — the entire yield curve accounts for under half a percent of it. Fed 2026-09-04’s own yield vector, the fit asks for 0.06 points of dispersion. The tape delivered 5.32.
It is a caution about the most available explanation in macro. The rate story is easy to tell, fits the day’s headline, and is almost entirely uninformative about which stocks moved. If you size a rotation on it you are trading a narrative with an R-squared of 0.005 — and payroll days turn out not to be dispersive days at all.
First: how much information is in the surprise
The +162,000 is real — taken from the BLS series itself, not a summary — and it is the strongest month since March’s +214,000. What made it matter is the three months in front of it: +63k, +31k, +21k, an average of 38,000 and decelerating.
Payrolls do move rates — by an entirely median amount
First, confirm the condition means something. Payroll Fridays genuinely move the curve more than ordinary Fridays: the five-year averages 6.11bp against 3.76bp (1.62×, z = +5.46), the ten-year 1.59×, the thirty-year 1.48×. Only the three-month shows no effect (1.07×, z = +0.39) — the bill is pinned to policy. This is the cleanest positive result in the study.
The equity split was a 99th-percentile event
Define dispersion as SOXX minus an equal-weight megacap basket excluding NVDA — Nvidia belongs to both sides and leaving it in contaminates the measure. On 2026-09-04 that was +5.32 points: SOXX +3.52%, megacap-ex-NVDA −1.80%.
| 2026-09-04 | Move | |move| percentile |
|---|---|---|
| Dispersion | +5.32 pts | 99.0 |
| Semis (SOXX) | +3.52% | 90.8 |
| Megacap ex-NVDA | −1.80% | 77.3 |
| SPY | −0.39% | 42.9 |
| Financials (XLF) | −0.79% | 58.0 |
The test: can rates explain the split?
Regress daily dispersion on the same-day basis-point change in all four tenors — 3-month, 5-year, 10-year, 30-year — across 2,683 sessions:
Three further checks, all pointing the same way. Out of sample the R-squared is −0.038% (n = 2,182) — a negative out-of-sample R-squared means the model loses to simply predicting the sample mean, so what it adds is noise. Charged for the eight arms this study searched, the observed family max|z| is 2.11 — exactly the median of its own empirical max-statistic null, which is to say the best thing the search found is precisely what a search that size returns by chance. And the sign of what little slope there is runs backwards to the story: higher yields go with semis outperforming megacap, not with long-duration being sold.
Are payroll days dispersive days? They are not.
This is the step most easily skipped and the one that matters. Mean absolute dispersion on payroll days is 114.7bp against 109.5bp elsewhere — higher, at a glance. But the null has to match on day of week: 98% of payroll days are Fridays, and a Friday is not an average day. Against 20,000 redraws matching the exact weekday composition, with the motivating session excluded so it cannot prove itself:
| Test | n | Result | Verdict |
|---|---|---|---|
| Dispersion larger on payroll days | 121 | p = 0.431 | NULL |
| Sessions with dispersion ≥ +5.32 | 14 / 2,684 | 0.52% | none were payroll days |
| Next-day follow-through | 14 | t = +0.17 | NULL |
After the close, the index changed
The second event of the day landed after the tape shut. S&P Dow Jones Indices announced its September rebalance: Bloom Energy, Illumina and Everpure join the S&P 500 before the open on 21 September, replacing Molson Coors, The Trade Desk and Builders FirstSource. After hours BE rose about 7.5%, Illumina 2%, Everpure 2.2%.
What this study does not claim
It does not explain why semiconductors rose. A sector moving 3.5% usually has a reason, and it may well be specific to semiconductors rather than macro — but nothing measured here identifies it, and the honest move is to say so rather than borrow the macro print because it happened the same morning.
It does not forecast the 15–16 September FOMC. Market-implied odds of a hike moved from roughly 52% to 59%; that is what the market prices, not a view, and a CPI print lands before the decision.
And it is not a trade. The one durable positive result here is a negative one — do not use the day’s rate move to explain a style split. There is no follow-through (t = +0.17), and this study produces no rule anyone should size.
Research · 2026-09-24
Who sells computing power to Anthropic, and who might be next?
Akamai is signed and confirmed. RUM Group has signed a deal, but that the customer is Anthropic is only reported. IREN has no Anthropic deal at all.
AI labs are signing multi-billion-dollar deals for computing power, and the seller's stock tends to jump when one is announced. Who has actually sold compute to Anthropic, who might be next, and does trying to get in early pay?
Anthropic buys from an unusually wide list: the big clouds, Nvidia-based neoclouds, four former bitcoin miners, a CDN (Akamai) and a video company's cloud arm (RUM). What they share is power that is already secured and deliverable by 2027–28. Five candidates survived a fact-check at MEDIUM — CIFR, IREN, GLXY, NBIS, KEEL — and none at HIGH.
When a small or mid-cap was named (n=8) it opened a median +13% but closed a median +7% above SPY, and four of the five gaps above 10% closed below their open. Twenty sessions later it was a coin flip. Deals are announced pre-market, after the close or in an evening press story, so this history shows no repeatable edge from positioning ahead of one.
The full ledger, source links and event study follow. Data as of the US close on 2026-09-24.
1. First, correcting the premise: IREN, RUM, AKAM
| Status | What is actually on the public record | Source tier | |
|---|---|---|---|
| Akamai (AKAM) | SIGNED (named) | Two contracts. (1) In its Q1 release after the close on 2026-05-07, Akamai disclosed a $1.8B, 7-year commitment from an unnamed "leading, U.S. based frontier model provider" (Q1 release). Bloomberg named Anthropic the next day. (2) The 8-K accepted 2026-09-24 at 16:14 ET names Anthropic. It covers $11.6B over 7 years for CPU workloads ("Project Plans 2 and 3", signed 09-18) under a master agreement dated 2026-05-05, with about $20B possible in total (release). Anthropic receives a warrant for about 5% of Akamai (see the ledger). That the May $1.8B was "Project Plan 1" is an inference from the 8-K's numbering. | Tier 1 |
| RUM Group (RUM), formerly Rumble Inc., renamed 2026-06-18 with the ticker unchanged (8-K) | Deal SIGNED; Anthropic identity REPORTED only | The 8-K accepted 2026-08-24 07:36 ET discloses a binding term sheet (not a definitive contract) worth $13.7B over 6 years with an "unaffiliated U.S.-based third party cloud customer". It covers 120 MW at Maysville, Georgia, targeted for early 2027, and a penny warrant to the customer. The Information named Anthropic on Sunday 2026-09-13, citing one source (relayed here, tier 3). As of 2026-09-24 neither RUM nor Anthropic has confirmed. RUM's last 8-K is dated 09-10, before the report (EDGAR checked today). The build is not yet financed. | Tier 1 (deal), Tier 2 (name) |
| IREN (IREN) | NOT SIGNED. Tender invitee only. | The AFR reported on 2026-07-05 that Anthropic had sent a ~1.4 GW Australian request for proposals to CDC, AirTrunk, NEXTDC, IREN and Stack, and might split it 4–5 ways (relay). No award to IREN has been reported. The first Australian lease went to the Zerra DC / Australian Data Centres / Macquarie consortium, which was not on the list (2026-09-16). The AFR then reported on 2026-09-22 that Anthropic is in advanced talks with AirTrunk for its Kurri Kurri site (tier-3 relay). IREN's FY26 results do disclose an Aug-2026 contract with an unnamed "leading frontier AI lab" (8-K), but no credible source identifies it, and it must not be assumed to be Anthropic. The "$15B" headline also contradicts IREN's own 10-K, which says Microsoft ($9.7B) plus NVIDIA ($3.4B) make up "a substantial majority" of its contracted revenue. | Tier 2 (tender); the $15B claim is Tier 3 and false |
Bottom line on the premise: AKAM is confirmed. RUM has a signed, unfinanced term sheet with a customer the press says is Anthropic. IREN is a stock that moved on a tender story. On the evidence so far, that tender is going to other bidders.
2. How to read the status labels
- SIGNED: a company release or filing names Anthropic, or Anthropic announced the deal itself.
- REPORTED: tier-2 press (Bloomberg, Reuters, WSJ, FT, CNBC, The Information) names Anthropic, and the counterparty has not confirmed.
- RUMOURED: an inference, or tier-3 sources only.
- TENDER: a named bidder in a reported procurement.
A deal is never promoted a level on weaker evidence. Tier-3 pages (aggregators, AI-written finance sites) are used here only as pointers or relays and never as sole support.
A few terms used below:
- MW / GW: the power a data-centre site can draw. "Gross" is total grid power; "IT" or "critical IT" is the smaller share the servers can use.
- Powered shell: a building with power and cooling that the tenant fills with its own chips.
- Neocloud: a GPU-rental cloud company.
- ERCOT: the Texas grid. Batch Zero is its new queue for approving large loads.
- Credit wrap: a stronger company guaranteeing a tenant's or landlord's payments.
3. The ledger
3a. Signed compute deals (tier-1 confirmation)
| Counterparty | Ticker | First public / confirmed | Size & term | Capacity / chip | Equity kicker | Source |
|---|---|---|---|---|---|---|
| Google Cloud TPUs | GOOGL | 2025-10-21 (Bloomberg) / 2025-10-23 | "Tens of billions" | Up to 1M TPUs, "well over a gigawatt" in 2026 | None to Anthropic. Reverse: Google is an Anthropic shareholder | Anthropic |
| Broadcom (TPU rack orders) | AVGO | 2025-09-04 (unnamed) / 2025-12-11 | $10B order + $11B additional | TPU racks | None | CNBC |
| Microsoft Azure + Nvidia | MSFT / NVDA | 2025-11-18 | $30B Azure commitment | Up to 1 GW; Grace Blackwell, Vera Rubin | None to Anthropic. Reverse: Nvidia up to $10B and Microsoft up to $5B into Anthropic | Anthropic |
| Fluidstack (US build) | Private | 2025-11-12 | $50B | Texas and New York; online through 2026 | None to Anthropic. Google backstops Fluidstack's leases and took warrants in its landlords (TeraWulf ~8% rising to ~14%; Cipher ~5.4%) | Anthropic |
| Hut 8, River Bend, Louisiana | HUT | 2025-12-17 | ~$7.0B, 15 yr (up to $17.7B with renewals) | 245 MW, up to 2,295 MW; first hall Q2-27. Lease is to Fluidstack with a Google backstop | None disclosed | Hut 8 |
| Google + Broadcom, next-gen TPUs | GOOGL / AVGO | 2026-04-06 | Not disclosed | "Multiple gigawatts" from 2027 (press ~3.5 GW; Anthropic later called it a "5 GW agreement") | None | Anthropic |
| CoreWeave | CRWV | 2026-04-10 | Not disclosed (press: multibillion) | Nvidia; capacity from later 2026 | None disclosed | CoreWeave |
| Amazon Web Services | AMZN | 2026-04-20 | >$100B over 10 yr | Up to 5 GW Trainium | None to Anthropic. Reverse: Amazon $5B now plus up to $20B more | Anthropic |
| SpaceX (xAI), Colossus I and II | SPCX (private at announcement) | 2026-05-06 | $1.25B/month to May 2029 (~$45B nominal ceiling); either side may terminate on 90 days' notice after month 3 | 300+ MW; ~325k Nvidia GPUs | None | Anthropic, S-1/A |
| Akamai, Project Plan 1 | AKAM | 2026-05-07 (unnamed) / 2026-09-24 | $1.8B, 7 yr | Akamai Cloud | None at the time | Q1 release, 8-K |
| TeraWulf, Hawesville, Kentucky | WULF | 2026-07-06 | ~$19B, 20 yr | 401 MW; H2-27 to early 2028 | None disclosed | TeraWulf |
| AMD Instinct MI450 | AMD | 2026-07-22 | Not disclosed | Up to 2 GW; first GW from H1-27 | None to Anthropic. Reverse: AMD up to $5B into Anthropic | AMD |
| Nscale, Monarch campus, West Virginia | Private (S-1 filed; proposed NYSE: NSCL) | 2026-08-26 (CNBC) / 2026-09-18 (S-1) | Up to ~$44.6B; four tranches; financing "best efforts", with termination of any tranche delivered late | Vera Rubin NVL72 | None found in the S-1 | S-1, CNBC |
| Western Downs (Zerra DC / Australian Data Centres / Macquarie), Queensland | Private. Listed look-through: Dexus (DXS.AX) owns 85% of ADC, which holds 25% of the consortium (≈21% economic) | 2026-09-16 | Campus A$32B; stage 1 not itemised | Anthropic takes Building One (of four ~360 MW buildings) from 2027, subject to FIRB approval | None disclosed | IPE Real Assets on Dexus's ASX release, ABC |
| Akamai, Project Plans 2 and 3 | AKAM | 2026-09-24 | $11.6B, 7 yr; ~$5.5B Akamai capex | CPU workloads, distributed footprint | Warrant, not penny: Series B convertible preferred into 7,741,020 shares (~5%), exercise $111.33 (AKAM closed $118.44 on 09-23), 7 yr, cash exercise. ~2% vests on the first Plan 3 payment, then ~1% per extra $3B spent | 8-K, Reuters via TradingView |
Western Downs is an upgrade from the working ledger, which had it as REPORTED because only the Queensland Premier had announced it. Dexus's ASX release of 2026-09-16 says the consortium "has entered lease documentation with the Australian subsidiary of Anthropic", subject to FIRB approval. That quote comes via IPE Real Assets, and ABC reports the lease as signed. I could not pull the ASX PDF itself in this pass, and Anthropic declined to comment.
3b. Reported, tender and rumoured (not confirmed by both sides)
| Counterparty | Ticker | Status | Date | What is public | Equity kicker | Source |
|---|---|---|---|---|---|---|
| RUM Group, Maysville, Georgia | RUM | REPORTED | 8-K 2026-08-24; named 2026-09-13 | $13.7B, 6 yr binding term sheet, 120 MW (expandable to 180), early 2027, unfinanced | Penny warrant: 50,808,408 Class A shares at $0.01 (~18% of Class A), 10 yr. Half vests over three $4.57B purchase tranches; half only on expansions above 2.5x | 8-K |
| Riot Platforms, Rockdale, Texas | RIOT | REPORTED (lease signed, tenant unnamed) | 2026-08-10 | $9.1B, 20 yr, 191 MW; 96 MW Dec-27, full Jun-28; tenant "one of the world's leading frontier AI labs" | None disclosed | 8-K exhibit, Bloomberg |
| Bitdeer, Tydal, Norway (lease to Volta) | BTDR | REPORTED | 2026-08-04 | $4.7B, 16 yr, 121 IT MW; end customer "a leading AI lab"; ~$1.3B of JPM-led letters of credit | "No Bitdeer equity securities or warrants were issued" | Bitdeer, Bloomberg |
| Volta Infra Holdings | Private | REPORTED | 2026-08-04 | $10B, 6 yr; Vera Rubin at Tydal | None disclosed | Bloomberg |
| Lambda (Nvidia-backed) | Private | REPORTED | 2026-08-31 | $35B; Nvidia holds the lease at Hut 8 Beacon Point, Texas | None disclosed | Bloomberg |
| Hut 8, Beacon Point, Texas | HUT | REPORTED | Leases 2026-07-20 (unnamed tenant); press link 2026-08-31 | 704 MW IT, 15 yr; $9.8B for phase 2 | None disclosed | Hut 8 exhibit |
| Nexus Data Centers, Hubbard, Texas | Private | REPORTED | 2026-07-30 | ~$15B of bank debt; TPUs; on-site 1.6 GW gas plant; Google guarantees Anthropic's lease | None to Anthropic; Google reportedly takes ~20% | Bloomberg, CNBC |
| AirTrunk, Kurri Kurri, NSW | Private (Blackstone) | REPORTED, advanced talks | 2026-09-22 | AFR: Anthropic "in advanced discussions to anchor" a proposed 540 MW campus; target 2028 | n/a | AFR, paywalled; tier-3 relay |
| Stream Data Centers | Private (majority Apollo, APO) | REPORTED, early talks | 2026-09-22 | The Information: early talks to lease up to 1 GW, likely TPUs, possibly with a Google credit guarantee | n/a | Investing.com relay of The Information |
| Meta Platforms | META | REPORTED, early talks | 2026-07-17 | NYT (via Reuters): talks for Anthropic to lease up to $10B of Meta compute over two years. Not re-verified in this pass. | n/a | US News / Reuters |
| Unnamed developers, 12+ letters of intent | — | REPORTED | 2026-06 | The Information: >1 GW of non-binding LOIs for direct leases. Shows a pipeline exists, not who is in it | n/a | tier-3 relay |
| Unnamed UK / Nordic / US operators | — | REPORTED, talks | 2026-09-18 | CNBC (four sources): talks on 20–30 MW inference sites because smaller sites energise faster. No counterparty named | n/a | CNBC |
| Australian tender: IREN, NEXTDC (NXT.AX), CDC (~48% Infratil, IFT.AX), AirTrunk (BX), Stack | various | TENDER | 2026-07-05 | ~1.4 GW (A$22B), ≥1 GW online by end-2027, possibly split 4–5 ways. First award went to a non-invitee; the second is reportedly heading to AirTrunk | n/a | AFR via Investing.com |
| Cipher Digital, Barber Lake, Texas (Fluidstack tenant) | CIFR | RUMOURED (strong inference) | — | 207 MW IT, ~$3.8B, 10 yr to Fluidstack with a Google backstop; first delivery Sep-26. On 2026-09-14 Cipher issued a release with Fluidstack and Anthropic committing $10M to the Colorado City water system. It states no tenancy | Google (not Anthropic) holds Cipher warrants | Cipher release, lease |
| TeraWulf, Lake Mariner NY / Abernathy TX (Fluidstack tenant) | WULF | RUMOURED | — | Anthropic's $50B plan says only "Texas and New York". No tier-1 or tier-2 source names these sites | Google holds TeraWulf warrants | TeraWulf |
| Meridian Arc, Indiana (Fluidstack JV) | Private | RUMOURED | 2026-04 | $5.7B of notes with a Google lease guarantee; Anthropic link inferred from Fluidstack's role | n/a | Cooley |
Non-compute Anthropic relationships that the screen found, which should not be confused with compute purchases: Lumen (fibre network, Investor Day release), Cloudflare (product integration for Claude agents, release), and DigitalOcean (resells Claude models).
3c. Where the listed exposure actually sits
About half of the 2026 capacity deals went to private intermediaries. The listed stock that moves is often a landlord one step removed, and sometimes there is none.
| Private intermediary | Listed exposure | Status of that link |
|---|---|---|
| Fluidstack | HUT (River Bend), CIFR (Barber Lake), WULF (Lake Mariner) | HUT SIGNED; CIFR and WULF inferred |
| Volta | BTDR (Tydal landlord) | REPORTED |
| Lambda (via Nvidia's lease) | HUT (Beacon Point landlord) | REPORTED |
| Nscale | Aker ASA (AKER.OL), about 22.7% fully diluted before IPO dilution; proposed NSCL listing | SIGNED (S-1) |
| Zerra DC / ADC | Dexus (DXS.AX), about 21% look-through | SIGNED per Dexus's ASX release (see note above) |
| AirTrunk | Blackstone (BX), too large to matter | REPORTED talks |
| CDC Data Centres | Infratil (IFT.AX), about 48% | TENDER only |
| Nexus, Stream | None meaningful (Apollo is majority owner of Stream) | REPORTED |
4. What the signed and reported counterparties have in common
- Time to power comes first. Every 2026 deal sells capacity that energises between now and mid-2028, on power that was already secured before the deal. Examples: SpaceX Colossus (immediate), Bitdeer Tydal (Dec-26 / Mar-27), RUM Maysville (early 2027), Hut 8 River Bend (Q2-27), TeraWulf Kentucky (H2-27), Riot Rockdale (Dec-27 / Jun-28), Nscale Monarch (on-site power). Anthropic's own reported targets point the same way: ≥1 GW in Australia by end-2027, and a turn to 20–30 MW sites because they are faster (CNBC).
- Two deal shapes.
- (a) Long powered-shell leases of 15–20 years, usually from ex-bitcoin miners (Hut 8, TeraWulf, Riot, Bitdeer via Volta). These rarely name a chip.
- (b) Compute-as-a-service for 3–7 years from companies that own the GPUs or CPUs (CoreWeave, Nscale, Lambda, Volta, RUM, SpaceX, Akamai). These are mostly Nvidia.
- Someone else's balance sheet backs the credit.
- Google backstops Fluidstack's leases and guarantees Anthropic's lease at Nexus.
- TeraWulf's Kentucky lease has "investment-grade credit" support.
- JPMorgan-led letters of credit back Volta at Bitdeer.
- Nvidia holds the Beacon Point lease.
- The two deals with no disclosed backstop carry the most financing risk: RUM (unfinanced) and Nscale ("best efforts").
- Equity sweeteners are rare. Only two warrants run to Anthropic itself: RUM's penny warrant (~18% of Class A) and Akamai's ~5% near-the-money warrant. Both came from non-traditional AI-infrastructure sellers for whom the contract is very large relative to their size, and both vest only as Anthropic actually spends. Bitdeer, Riot, TeraWulf, Hut 8 and Nscale granted none. The usual flow runs the other way: Amazon, Nvidia, Microsoft and AMD invest in Anthropic.
- Chip-agnostic. Anthropic buys TPU, Trainium, Nvidia and AMD accelerators, and now CPU capacity (Akamai). The fit test is power, building and delivery date, not chip.
- Geography. Mostly the US, concentrated in Texas/ERCOT, plus KY, LA, WV, GA, NY and IN. Abroad: Norway (Tydal) and Queensland (Western Downs), plus reported talks in the UK and Nordics.
- Disclosure usually comes in two steps. The seller discloses an unnamed "frontier AI lab" deal, and the name then comes out through Bloomberg, WSJ, CNBC or The Information. The gap has been the same evening (Riot, Bitdeer), one day (Akamai in May), three weeks (RUM) or six weeks (Hut 8 Beacon Point). Some sellers never name tenants at all (Applied Digital, Digital Realty, Iron Mountain).
Screening rubric used on candidates, roughly in order of weight:
- (1) At least 100 MW of power secured, energising in 2026–28, or a large distributed footprint.
- (2) That capacity is uncontracted.
- (3) A credit wrap is available, or the balance sheet can fund the build.
- (4) A contract would be large relative to market cap. This is what amplifies any price reaction.
- (5) A history of issuing warrants to strategic partners.
- (6) Located in a stated Anthropic geography.
- (7) Discloses an unnamed "frontier lab" relationship. That is a flag only, never an identification.
5. Candidates that survived verification
Five category screens produced about 50 names. The strongest 13 (IREN twice, once from each screen that picked it) were then fact-checked by a separate agent tasked with knocking each one off the list, working from filings and prices. Eleven survived, all at MEDIUM or LOW, and two were dropped. Every HIGH rating that went through the check was cut. The fits below are the corrected ones. The two first-pass HIGH names that were not checked are AirTrunk and Infratil/CDC. AirTrunk is private and is carried in the ledger as REPORTED talks; Infratil is covered in §6.
Summary
| Name | Ticker | Category | Fit (screen → verified) | Capacity that is actually free, and when | Public Anthropic link (tier) | Mkt cap |
|---|---|---|---|---|---|---|
| Cipher Digital | CIFR | Powered land (ex-miner) | HIGH → MEDIUM | Reveille 70 MW gross (Q3-27) and Ulysses 200 MW gross (Q4-27), "in discussions"; Odessa 207 MW energised (still mining) | Joint water release with Fluidstack and Anthropic (T1), no tenancy stated; Barber Lake end user inferred | ~$7.6B |
| IREN | IREN | GPU cloud + powered land | HIGH → MEDIUM | 2027 capacity mostly in "late-stage discussions"; clearly free MW are 2028+ | TENDER (T2); awards so far went elsewhere | ~$18.5B |
| Galaxy Digital | GLXY | Powered land | HIGH/MED → MEDIUM | 830 MW gross approved, unleased; energises 2028 | None | ~$10B |
| Nebius Group | NBIS | GPU cloud | HIGH → MEDIUM | No MW disclosed; some 2027 capacity held back; a Meta-backstopped pool it wants to resell | None at T1/T2 | ~$62B |
| Keel Infrastructure | KEEL | Powered land (ex-miner) | MEDIUM → MEDIUM | ~478 MW gross utility-secured, unleased; ready 2027 | None | ~$2.5B |
| Applied Digital | APLD | Powered land | MEDIUM → LOW | "1.7 GW" of grid power marketed (≈1.1–1.2 GW IT); sites and dates undisclosed | None | ~$7.9B |
| MARA Holdings | MARA | Powered land (miner) | MEDIUM → LOW | Long Ridge (purchase not closed), Matagorda (purchase rights only) | None | ~$5.2B |
| Bitdeer | BTDR | Powered land (miner) | MEDIUM → LOW | Tydal Phase 3, 47 MW gross (H2-27); Rockdale new parcel, undated | REPORTED (Tydal via Volta) | ~$3.35B |
| DigitalOcean | DOCN | CPU/GPU cloud | MED/LOW → LOW | ~80 MW added in 2027–28, apparently spoken for | None (it resells Claude) | ~$16.6B |
| Digital Realty | DLR | Colocation REIT | MEDIUM → LOW | ~645 MW open at 6/30, less after July leases | None | ~$67B |
| Iron Mountain | IRM | Colocation REIT | MEDIUM → LOW | ~21 MW unleased under construction | None | ~$34B |
A. Powered land and ex-bitcoin miners
Cipher Digital (CIFR): MEDIUM.
- Facts (Q2 update):
- About $11.4B contracted.
- Black Pearl, 300 MW gross, leased to AWS; delivery began in August.
- Stingray, 70 MW IT, leased to AWS for 15 years.
- Barber Lake, 300 MW gross / 207 MW IT, leased to Fluidstack with a Google backstop; delivery Sep-26.
- Uncommitted: Reveille (70 MW gross, Q3-27) and Ulysses (200 MW gross, Q4-27), both "in discussions for HPC hosting lease". Odessa (207 MW gross) is energised but still mining.
- Mikeska, McLennan and Colchis (500/500/1,000 MW, 2028) are expected, not confirmed, to be included in ERCOT Batch Zero.
- Why it fits: ERCOT power arriving in 2027. A proven route to a credit wrap. Google already holds warrants (≈5.5–5.8%). On like-for-like 10-year terms, a Ulysses-sized lease is about $2.6B, roughly a third of market cap.
- Anthropic link: Cipher issued the 2026-09-14 water-system release jointly with Fluidstack and Anthropic (T1). It places Anthropic in the Barber Lake town but states no tenancy. Read alongside Anthropic's "Texas and New York" Fluidstack build, it points strongly to Anthropic as Barber Lake's end user. That remains unconfirmed.
- Against: if that inference is right, Cipher's "first Anthropic deal" has effectively already happened, and anything next would be a follow-on through Fluidstack, not a new-name re-rating. No report ties Anthropic to Reveille or Ulysses. The stock is -30% over 3 months. It did outperform after the water release: +10.8% on 9/16 against a peer median of about +3.6%, and +19.9% from the 9/15 close to 9/24. No source ties that move to the release.
- Public events that would change this: an 8-K lease for Reveille or Ulysses, or any tier-1 statement of Barber Lake's end user.
IREN (IREN): MEDIUM.
- Facts:
- 2026 capacity is "largely sold out" ($4B contracted ARR).
- For 2027 (≈0.8 GW IT / 1.2 GW gross) it is in "late-stage discussions with a range of new customers over a significant portion" (FY26).
- The Sweetwater hub has 2 GW of power, but only 300 MW gross (~200 MW IT) is under construction, for Q4-27. Its ERCOT base-load listing is "conditional" (release).
- Texas ordered an audit of the ERCOT queue on 2026-08-03, and the verification process is expected to take "several months" (10-K risk factors).
- Bundey, South Australia (800 MW) starts energising in 2028, which misses the reported end-2027 Australian target.
- Committed elsewhere: Microsoft ($9.7B, Childress); NVIDIA ($3.4B, 5 yr, 60 MW at Childress); July contracts with Prometheus, Perplexity, Together AI and others (8-K); an unnamed frontier lab (Aug-26). IREN says it deliberately spreads capacity across many customers.
- Anthropic link:
- TENDER (AFR, T2) is the only direct link.
- Fluidstack is a named IREN customer (T1, indirect).
- The Australian awards so far went to Zerra/ADC and, per the AFR, AirTrunk.
- Against:
- The tender is a lease deal, so IREN's GPU-cloud advantage does not apply to the one process where it has a documented link.
- Much of the speculation is already in the price: from the pre-report close on 7/2 to 9/23, IREN is roughly +21% against a peer average of about -5%.
- At ~$18.5B, a contract worth a few billion would move it far less than it moved RUM or AKAM.
- Public events that would change this: the remaining Australian award decisions, or any identification of the Aug-26 frontier-lab contract.
Galaxy Digital (GLXY): MEDIUM.
- Facts:
- Helios, Texas has 1.63 GW of approved power. CoreWeave leases 800 MW gross / 526 MW IT for 15 years.
- The other 830 MW is approved but not leased. Galaxy is "advancing discussions with prospective tenants" (Q2).
- That block is classed ERCOT Batch Zero Base Load, i.e. not subject to further allocation, and is "on schedule to energize in 2028" (Galaxy release, 2026-09-08).
- Phase II is funded by $3.507B of notes.
- Why it fits: the largest approved, unleased ERCOT block among the listed developers. Anthropic has signed 2028-dated capacity before: Riot's second phase lands Jun-28.
- Anthropic link: none. EDGAR full-text search finds zero Galaxy filings mentioning Anthropic. CoreWeave, its tenant, is a signed Anthropic supplier, but nothing places Anthropic workloads at Helios.
- Against:
- Energisation is not until 2028, and usable data halls come later still.
- It is not a pure play: trading and asset management dilute the effect of any lease.
- A CoreWeave right of first refusal on expansion could not be ruled out.
Keel Infrastructure (KEEL, formerly Bitfarms): MEDIUM.
- Facts:
- Keel shut US bitcoin mining in June 2026 to lease HPC capacity, and has no HPC lease yet.
- About 478 MW gross is utility-secured and unleased across three priority sites: Panther Creek PA, 350 MW with PPL, expandable to about 500; Sharon PA, 110 MW; Moses Lake WA, 18 MW. Ready for service in 2027 (10-Q, Q2 release).
- Management describes structures that pair "fast-growing AI companies with investment grade credit support", the same template as the Fluidstack/Google deals.
- Anthropic link: none at any tier.
- Against:
- Keel guided to "lease execution in 2026" and has not delivered it. Pennsylvania environmental permits are running "a few months longer".
- No credit wrap exists yet.
- PJM and Washington are not reported Anthropic geographies, though the nearest signed site, Nscale Monarch in West Virginia, is in the same region.
- The stock is down 40% from its June high and moves with the sector.
Applied Digital (APLD): LOW.
- Facts: ~1,410 MW IT (~$36.2B) is contracted to CoreWeave and two investment-grade hyperscalers. One of them signed three leases totalling 810 MW in seven weeks (10-K).
- What is free: the "1.7 GW" being marketed is grid power (≈1.1–1.2 GW IT), with sites and dates undisclosed (FY26 release). Part of it may be the Polaris Forge 2 expansion, where the existing tenant holds a right of first refusal (8-K).
- Against:
- Every APLD lease is with CoreWeave or an investment-grade hyperscaler and is financed on that tenant's credit. A direct Anthropic lease would need a guarantor.
- APLD does not name tenants, so there may never be a naming event.
- Anthropic link: none.
MARA Holdings (MARA): LOW.
- Facts:
- No HPC tenant yet. MARA says it is "confident" of "at least one lease before year-end" (Q2 letter).
- Neither flagship HPC site is owned yet. The Long Ridge purchase has not closed and awaits FERC. At Matagorda MARA holds only purchase rights; the seller targets up to 1 GW by Oct-27 and 2 GW by Apr-28, subject to approvals (10-Q).
- Under the Starwood JV, MARA takes only a 10–50% stake in each project (8-K), which shrinks how much any lease matters to MARA's own shares.
- Anthropic link: none.
Bitdeer (BTDR): LOW. Already Anthropic-adjacent through Tydal (REPORTED), so anything further would be a follow-on.
- Facts:
- Rockdale's 563 MW stays in bitcoin mining. The AI plan is on a newly bought 200-acre parcel with about 179 MW more power, no disclosed approvals and no date.
- The most direct follow-on is Tydal Phase 3: 47 MW gross, H2-27, outside the Volta lease.
- Knoxville (86 MW, Q3-27) is earmarked for Bitdeer's own AI cloud.
- The balance sheet is stretched: about $496M of cash against $1.8B of borrowings at 6/30 (Q2).
- Price reaction: on the Tydal day BTDR gapped +12.4%, closed +0.1%, and was -23.6% five sessions later.
B. GPU and CPU clouds
Nebius Group (NBIS): MEDIUM.
- Facts (Q2-26 letter):
- "We could sell our entire 2027 capacity on these terms today", but Nebius is holding some back for customers with immediate needs.
- A first short-term (3–6 month) capacity deal goes live in Q4. Short-term pricing is $40–50M per MW of annualised contract value.
- Target of 5 GW of contracted land and power (not built capacity) by year-end, and more than 1 GW a year of deployment from 2027.
- Meta has committed to buy up to $15B of spare capacity on upcoming clusters, which Nebius "intends to sell to third-party customers" (Meta deal).
- UK capacity is 65 MW across four sites by 2027 (UK release). That matches the size of the UK/Nordic sites CNBC reported Anthropic is seeking.
- Committed elsewhere: Microsoft ($17.4–19.4B, delivered); Meta (~$3B, plus up to $27B on Vera Rubin); remaining performance obligations of $37.5B at 6/30. NVIDIA invested $2B (tier 1).
- Anthropic link: none at tier 1 or 2. Tier-3 claims appear to confuse Nvidia's list of Rubin adopters, which names Anthropic and Nebius separately (Nvidia), with Anthropic contracts.
- Against:
- Near-term capacity is mostly sold, and no free MW are disclosed.
- Short-term pricing is about 2–2.5 times the per-MW cost implied by Anthropic's Nscale and RUM deals.
- At ~$62B, a RUM-sized $13.7B deal would be about 22% of equity, so expect a CoreWeave-like reaction, not an Akamai-like one.
- The "rival bidder that lost" story is mostly sector noise. NBIS rose 6.3% on the day CoreWeave signed with Anthropic.
DigitalOcean (DOCN): LOW.
- Facts:
- About 155 MW committed in total, with about 60 MW "throughout 2027" and 20 MW more in 2027–28.
- Remaining performance obligations jumped to $894M on "nine-figure" commitments from unnamed AI-native customers (Q2, 10-Q).
- The only plausible route is the Akamai precedent (CPU work). But Akamai's deal alone, about $1.66B a year, exceeds DOCN's entire 2026 revenue guide of $1.17–1.18B.
- Anthropic link: DOCN resells Claude models. That is a distribution link, not a compute-supply link.
- Price: up 189% year to date, so a lot of AI re-rating is already in the price.
C. Colocation REITs
Digital Realty (DLR): LOW.
- Facts: 1,402 MW under construction, 54% pre-leased at 6/30 (Q2 supplemental). Two July US hyperscale leases ($410M a year) probably absorbed the largest open US blocks, though where they landed is not disclosed.
- Against:
- Only Frankfurt (~22 MW open, 1Q27) fits the reported small-site size and timing, and it is not in the UK or Nordics.
- DLR anonymises tenants, so there may be no naming event.
- A 20–30 MW lease is immaterial against a ~$67B market cap.
- Anthropic link: none (zero EDGAR hits).
Iron Mountain (IRM): LOW.
- Facts:
- The operating portfolio of 528.5 MW is 97.1% leased.
- Only about 21 MW is both unleased and under construction (Madrid, India).
- The ~325 MW "available" is land and power held for development. It is a company forecast, and it has shrunk each quarter (Q2 presentation).
- IRM's credit is sub-investment-grade, and it names tenants only as "major global hyperscalers".
- Anthropic link: none.
6. Knocked out or set aside, and why
Failed verification:
- WhiteFiber (WYFI), DROPPED. Its supposed Anthropic link ran through Nscale. But Nscale's S-1 places the Anthropic contracts at Monarch, West Virginia, not at WhiteFiber's North Carolina site. WhiteFiber has no capacity that is both owned and free: NC-1 is contracted to Nscale, and NC-2/NC-3 are not yet owned and already have letters of intent (deck). It traded as a loser on others' Anthropic days: -8.1% on 9/14 and -7.5% on 9/1.
- Aker ASA (AKER.OL), DROPPED as a "next" name. It is already an indirect signed exposure, through its stake in Nscale (S-1).
- The stake is about 22.7% fully diluted and shrinking with the IPO, worth roughly 29% of Aker's cap.
- The stock is +91% year to date, above its own NAV, and fell 5.8% after the S-1 named Anthropic.
- The S-1 says no binding financing is yet in place for the Anthropic tranches.
Screened, but set aside before verification:
- Committed to someone else:
- Core Scientific (CORZ): AMD holds a reservation right over 1,925 MW through 2028 (8-K).
- CleanSpark (CLSK): its tenant is named as a Meta subsidiary, and Meta has exclusivity over its Texas portfolio (deck).
- Oracle: committed largely to OpenAI.
- Equinix: large-block capacity pre-leased.
- Crusoe (private) and HIVE: committed elsewhere.
- Said no, or the wrong business:
- Cloudflare's CEO called lending its balance sheet for AI servers "not attractive business"; Fastly said it is not building a neocloud. Both come from transcript relays (tier 3).
- Backblaze sells storage, not compute, though it has issued warrants to CoreWeave.
- Lumen's Anthropic contract is for fibre.
- Unnamed "frontier lab" disclosures that must not be read as Anthropic:
- Atlas Energy Solutions (AESI): its 2026-09-24 8-K covers ~328 MW of generation for an unnamed lab in Shackelford County, TX, which is also a publicly announced OpenAI Stargate county (8-K).
- SharonAI (SHAZ): an unnamed "global AI lab" contract.
- Second-order suppliers with no amplifier:
- Utilities behind signed sites (Entergy, AEP), independent power producers (Vistra, Talen, NRG, Constellation), and Caterpillar (gen-sets for Monarch).
- Solaris Energy (SEI) co-owns with xAI a power JV that serves Colossus, which Anthropic rents under the SpaceX deal (offering memo). That link is second-order, and the SpaceX contract is terminable on 90 days' notice.
- Australian tender names (NEXTDC, Infratil/CDC): tracked as TENDER rows in the ledger, not rated as candidates here, because neither was put through the knock-off check. NEXTDC's near-term build is already contracted. CDC's 555 MW contract with a US "high-end investment grade customer" is hyperscaler language, not frontier-lab language. The reported front-runner status of CDC (AFR, May) has produced no award in four months.
- Fermi (FRMI) / TensorWave: no power delivered yet, no credit wrap, and AMD chips do not point uniquely to Anthropic.
7. Did the stocks actually rip, and did it hold?
Method.
- day0 is the first session that could trade the news; after-close news counts on the next day.
- gap is open(d0) / close(d-1). ret0 is close(d0) / close(d-1).
- xSPY is ret0 minus SPY's same-day return.
- z is xSPY divided by the stock's own trailing 60-session standard deviation of xSPY.
- +5 and +20 are measured from the day0 close. now is the 2026-09-24 close. \* marks fewer than 20 sessions so far.
- All figures are %. Prices come from the Yahoo daily close series; timestamps come from EDGAR acceptance times.
- Sample sizes are small, so no p-values are given, on purpose.
A. Counterparty events (# = the "named small/mid-cap" core, n=8)
| Sym | day0 | gap | ret0 | xSPY | z | +5 | +20 | now | What the market learned |
|---|---|---|---|---|---|---|---|---|---|
| AKAM# | 26-05-08 | +24.6 | +26.6 | +25.8 | 5.8 | +2.1 | -4.0 | -25.3 | Unnamed $1.8B in Q1 results; Bloomberg named Anthropic. Earnings day |
| RUM | 26-08-24 | -0.7 | +3.4 | +3.7 | 0.8 | -4.3 | -4.3 | -8.1 | 8-K, customer unnamed; +21% run-up beforehand (own Q2 results in window) |
| RUM# | 26-09-14 | +7.0 | +11.6 | +12.0 | 2.7 | +14.6 | +7.5\* | +7.5 | The Information named Anthropic (one source); unconfirmed |
| RIOT# | 26-08-11 | +21.5 | +4.3 | +4.6 | 0.9 | -6.6 | +9.0 | +16.0 | Lease inside Q2 results 8-K; Bloomberg named Anthropic that evening |
| HUT# | 25-12-17 | +13.8 | +9.0 | +10.1 | 1.5 | +31.5 | +48.5 | +152.8 | River Bend release names Anthropic (SIGNED) |
| HUT | 26-07-20 | +11.0 | +10.4 | +10.5 | 1.6 | +3.6 | -12.8 | +0.6 | Beacon Point lease, tenant unnamed; whole sector up (WGMI +10.8) |
| HUT# | 26-09-01 | +1.0 | -1.4 | -0.7 | -0.1 | +23.7 | +30.9\* | +30.9 | WSJ: Lambda–Anthropic at Beacon Point (REPORTED) |
| IREN | 26-07-06 | +8.1 | +13.1 | +12.2 | 2.1 | -11.2 | -9.5 | +5.1 | AFR tender shortlist (TENDER) |
| WULF# | 26-07-06 | +14.0 | +4.9 | +4.0 | 0.9 | -5.9 | -15.2 | -26.7 | Release names Anthropic, Kentucky 401 MW (SIGNED) |
| BTDR# | 26-08-04 | +12.4 | +0.1 | -1.7 | -0.2 | -23.6 | -9.1 | +6.8 | "Leading AI lab" release + Bloomberg name; full intraday fade |
| CIFR | 26-09-15 | -0.7 | -3.5 | -3.0 | -0.4 | +26.5 | +19.9\* | +19.9 | Water-system release (9/14 17:02); tenancy RUMOURED only |
| CIFR | 25-11-12 | +0.2 | -6.9 | -7.0 | -0.8 | -15.9 | +8.6 | +4.1 | Anthropic $50B Fluidstack TX/NY; link inferred |
| WULF | 25-11-12 | +1.5 | +2.2 | +2.1 | 0.4 | -3.2 | +25.2 | +28.9 | Same; link inferred |
| CRWV# | 26-04-10 | +1.6 | +10.9 | +10.9 | 1.8 | +14.6 | +11.9 | -11.6 | CoreWeave release (SIGNED); Meta 8-K on 4/9 in pre-window |
| GOOGL | 25-10-22 | +1.6 | +0.5 | +1.0 | 0.5 | +9.1 | +16.3 | +36.0 | Bloomberg: talks |
| GOOGL | 25-10-24 | +1.4 | +2.7 | +1.9 | 1.0 | +8.2 | +15.3 | +31.7 | Official announcement |
| MSFT | 25-11-18 | -2.4 | -2.7 | -1.9 | -2.1 | -3.4 | -3.6 | +0.8 | |
| NVDA | 25-11-18 | -1.7 | -2.8 | -2.0 | -1.0 | -2.0 | -5.7 | +23.8 | |
| AVGO | 25-12-12 | -6.5 | -11.4 | -10.4 | -4.2 | -5.4 | -1.5 | -2.7 | Earnings-confounded |
| AMZN | 26-04-20 | -0.5 | -0.9 | -0.7 | -0.4 | +5.2 | +6.7 | +0.4 | |
| AMD | 26-07-22 | -3.2 | +1.5 | +1.6 | 0.3 | -22.2 | -15.6 | +13.9 | |
| NXT.AX | 26-07-06 | +1.0 | -0.7 | -0.5 | -0.2 | +1.4 | +1.2 | -14.3 | TENDER |
| IFT.AX | 26-07-06 | +4.1 | +1.4 | +1.5 | 0.7 | +1.7 | -1.5 | -7.9 | TENDER (CDC parent) |
What it shows:
- Core named small/mid-caps (n=8): median gap +13.1, median ret0 +6.9, median xSPY +7.4, with 6 of 8 positive. Of the 5 gaps above 10%, 4 closed below the open.
- Only three stood well out of normal daily noise: AKAM in May (+25.8 over SPY, 5.8 standard deviations, on an earnings day), RUM on its naming (+12.0, 2.7 sd) and CRWV (+10.9).
- Did it hold? At +20 sessions the median xSPY was +5.0, with 5 of 8 positive and a range of -16.1 to +45.5. That is inside these names' normal 20-session noise of roughly 17–31% (daily xSPY standard deviation: AKAM 3.7, RUM 4.6, RIOT 5.2, WULF 5.5, CRWV 5.7, HUT/BTDR/IREN 6.5, CIFR 6.9).
- AKAM gave back its entire May move (-25.3% by 9/24) before today's confirming 8-K.
- WULF is -26.7% from its day0 close.
- HUT's River Bend deal (+152.8%) is the one lasting winner.
- Megacaps (n=7) did not move on Anthropic news: xSPY ranged from -10.4 to +1.9, median -0.7.
- Named vs unnamed: RUM rose +3.7 over SPY on its unnamed 8-K and +12.0 when named. Hut 8's unnamed lease just moved with its sector. That is n=2, so a pattern, not a rule.
- No leak pattern. Run-ups before AKAM, RUM and CRWV each have another public explanation.
Pending: AKAM's confirmation (8-K 2026-09-24, 16:14 ET). Day0 is 9/25 and has not traded yet.
- After hours, the last trade was 133.21 against a 110.41 close (+20.7%), with a high of 148.0. These are thin extended-hours prints (SiliconANGLE).
- Even at 133.21, AKAM is 9.8% below its 5/8 day0 close.
- AKAM fell 6.8% in the regular session before the filing.
- Peers barely moved after hours: FSLY +4.2, NET 0.0, DOCN +0.3, CRWV -0.4, NBIS -0.5.
B. What happened to everyone else on deal days (same-day return minus SPY)
"Med" is the median of 11 miner/HPC names, winner excluded. "e" = the peer had its own earnings that day.
| day0 | Event (winner) | Miner/HPC median | WGMI (miner ETF) | CRWV | NBIS |
|---|---|---|---|---|---|
| 25-11-12 | $50B Fluidstack | -5.0 | -4.7 | -3.4 | -7.7 |
| 25-12-17 | HUT River Bend (HUT +10) | -5.5 | -3.7 | -6.0 | -5.7 |
| 26-04-10 | CRWV (+11) | +2.0 | +2.1 | winner | +6.4 |
| 26-05-08 | AKAM | -1.0 | 0.0 | -12.2e | -5.0 |
| 26-07-06 | WULF + IREN report (IREN +12, WULF +4) | +3.6 | +5.3 | +4.9 | -2.1 |
| 26-08-04 | BTDR/Volta (BTDR -2) | -1.7 | -5.5 | +5.4 | +4.4 |
| 26-08-11 | RIOT (+5) | +2.7 | +2.8 | +2.7 | +5.3 |
| 26-08-24 | RUM 8-K (unnamed) | -1.3 | -2.1 | -1.5 | -3.5 |
| 26-08-26 | Nscale (private; CNBC) | -3.4 | -3.4 | -0.1 | -3.6 |
| 26-09-01 | Lambda / HUT (HUT -1) | -4.0 | -3.3 | -2.9 | -2.6 |
| 26-09-14 | RUM named | -3.6 | -4.2 | -6.3 | -5.1 |
| 26-09-15 | CIFR water release (CIFR -3) | -4.7 | -3.6 | -2.0 | -1.8 |
| 26-09-16 | Western Downs award (private) | +3.6 | +3.9 | +3.4 | +1.4 |
- The median miner fell on 9 of 13 winner days. Mostly the whole AI-infrastructure group moved together, rather than traders selling "losers". Across 223 non-winner peer-days, only 1% of miner days and 4% of neocloud days moved more than 2 standard deviations.
- On the RUM naming day CRWV and NBIS closed -6.8% and -5.5% raw. The "~9%" figures in circulation were NBIS's open and intraday low. Miners fell just as much (HUT -7.6, WULF -7.6, CIFR -7.2, APLD -7.0), and five sessions later CRWV was +3.0 and NBIS +9.7.
- The biggest peer drops on winner days were earnings, not deal losses: NET -24.4 and CRWV -12.2 on 5/8.
- Smaller single names did trade as losers: WhiteFiber fell 8.1% on 9/14 and 7.5% on 9/1.
C. IREN on tender-report days
| day0 | gap | ret0 | xSPY | +1 | +5 | +20 | Report |
|---|---|---|---|---|---|---|---|
| 26-05-26 | +5.0 | +5.2 | +4.5 | +13.5 | +11.4 | -15.9 | AFR shortlist (AirTrunk/NEXTDC/CDC/Firmus); IREN not named |
| 26-05-27 (alt day0) | +3.4 | +13.5 | +13.5 | -5.6 | -3.5 | -29.6 | Confounded: IREN's own Dell / $4.4bn ARR release the prior evening |
| 26-07-06 | +8.1 | +13.1 | +12.2 | -9.3 | -11.2 | -9.5 | AFR: 1.4 GW RFP, IREN on the shortlist (the only report naming it) |
| 26-08-28 | -7.1 | -12.5 | -12.3 | +4.7 | +26.0 | +30.2\* | Own FY26 results: unnamed "leading frontier AI lab" contract |
| 26-09-16 | +2.1 | +2.5 | +2.9 | +2.0 | +10.4 | +8.3\* | Western Downs award announced; IREN not awarded |
| 26-09-21 | +2.5 | +1.2 | -0.4 | +2.8 | -2.3\* | -2.3\* | AFR: AirTrunk Kurri Kurri talks; IREN not mentioned |
| 26-09-22 (alt day0) | -0.5 | +2.8 | +2.8 | -3.1 | -4.9\* | -4.9\* | Same report; US day0 ambiguous |
"IREN moved several times on Anthropic tender reports" comes down to one report (7/6, +12.2 over SPY). It reversed the next day, although most of that reversal was sector-wide: peers fell about 7% on average. Twenty sessions later IREN was 9.5% lower. IREN's biggest days since May were mostly not tender-related: +28.9 (7/30, a sector rally after MSFT/META earnings), +19.7 (7/20, its own update) and -12.3 (8/28, earnings). IREN also showed no penalty when awards went elsewhere.
8. What this is, and what it is not
- A candidate list is not a forecast. It sorts public facts about spare power, timing and fit. It contains nothing about what Anthropic will do. This brief was written by an Anthropic model with no non-public information, and it would be wrong to read it as anything else.
- The base rate of any one name being picked is low. About seven listed small/mid-caps were tied to Anthropic compute, signed or reported, in the roughly nine months from December 2025 to September 2026: HUT, CRWV, AKAM, WULF, BTDR, RIOT and RUM. The screen drew on a field of about 50 plausible listed names. Even at that pace, it is under one new name a month spread across dozens of candidates. About half the capacity went to private companies (Fluidstack, Volta, Lambda, Nscale, Nexus, Zerra, and possibly AirTrunk and Stream) with no listed pure play at all.
- IREN shows how a stock can run on reports that never close. It jumped 13% on a tender story, faded, and has since watched two Australian awards go elsewhere. Meanwhile an unnamed-customer disclosure invited speculation that no credible source has confirmed. The widely indexed "$15B contract" is false.
- Deal days have hit competitors. Usually it is the whole AI-infrastructure group falling together, but single names like WhiteFiber have traded as the loser. A name on a candidate list can fall on the day someone else is picked.
- The move happens at the announcement, and nobody outside the deal can time it.
- Releases landed pre-market (Hut 8, TeraWulf, RUM at 07:36 ET), after the close (Riot 16:22 ET, Akamai 16:14 ET), or as evening and weekend press stories (Bloomberg on Riot; The Information on a Sunday for RUM).
- The typical pattern was a big opening gap that faded.
- Some sellers never name tenants at all, so a deal can happen with no naming event.
- This history shows no repeatable edge from positioning ahead of a deal. With n≈8 and daily noise of 4–7%, 20-session outcomes were a coin flip.
- Not financial advice. Nothing here is a recommendation to buy, sell or hold anything. There are no price targets and no position sizes.
9. Gaps and data notes
- Tier-2 press sweep incomplete. The web-search budget ran out during verification. Several "no Anthropic link" findings (APLD, KEEL, GLXY, DLR, IRM, NBIS) rest on SEC full-text search, company filings and Anthropic's newsroom, not on a fresh Bloomberg/Reuters/The Information sweep.
- Western Downs upgraded to SIGNED on Dexus's ASX release as quoted by IPE Real Assets and reported by ABC. The ASX PDF itself was not retrieved.
- Corrections made while writing:
- The Cipher water release is a Cipher-issued GlobeNewswire release dated 2026-09-14. I re-checked this, because one verification pass had called it a Fluidstack-only page.
- EDGAR acceptance times for RUM (07:36 ET), Riot (16:22 ET), IREN FY26 (16:13 ET) and Akamai (16:14 ET) were re-checked against the filing index pages.
- Price-data notes:
- Yahoo left the 9/22 close blank for 13 symbols and 9/24 for all US symbols. 9/22 was rebuilt from 5-minute bars and 9/24 taken from the 16:00 regular-market price. Against 74 official closes, the rebuilt figures are off by a median 0.03% (max 0.55%).
- The ASX 9/25 bar was dropped because it was still trading when fetched.
- Not re-verified in this pass: Meta talks (NYT via Reuters), the AirTrunk Kurri Kurri report (AFR, read via tier-3 relays), and the 12+ LOIs (The Information, via a tier-3 relay).
- Working files (scratchpad):
anthropic_ledger.json(ledger plus event returns),wf_candidates.json,wf_verdicts.json,study_main.csv,sympathy.csv,confounds.csv,px3/(patched daily prices),intra/summary.json(intraday and after-hours data).
Research · 2026-09-15
When does the market actually move on a Fed day?
By half past one, an ordinary day has already set 85% of its high and low. A Fed decision day has set 49%. Half the day is still to come.
Every session has a high and a low, and the distance between them is the day’s range. That range is not set all at once — it gets discovered through the session, usually mostly in the first hour or two. What we measured is that process: at each moment, how much of the day’s eventual range has already happened. Two independent samples — 16 meetings on hourly bars and 8 on five-minute bars — trace almost exactly the same curve.
On a Fed decision day the statement lands at 2:00pm and the press conference starts at 2:30. Does the market really wait for it — and if it does, how much of the day is left when the waiting ends?
It waits, and it waits harder than you would guess. An ordinary session has completed 85% of its high-low range by 1:30pm; a Fed day has completed 49%. In absolute terms the Fed day is not just proportionally back-loaded — it runs narrower than an ordinary day all morning (0.57% against 0.88% by 1:30), crosses over at 2:40 and ends wider. And the larger move belongs to the press conference, not the statement: the 2:30–3:00 half hour adds 20.9 points of the day’s range against 7.3 for the statement itself.
It says where the risk on this one day actually sits, and it is not spread across the session. It also explains a thing people misread as calm: a quiet Fed morning is not the market telling you the day will be quiet, it is the market declining to trade until it has the information. Note what this does not say — the day ends wider but not further away, so a bigger range is not a bigger closing move.
First, the scale — how it differs from a normal day
This chart does not normalise anything. The vertical axis is the actual width travelled, as a percentage of the prior close. The interesting part is that a Fed day runs below an ordinary day for the entire morning — by 1:55pm it has covered 0.55% against an ordinary day’s 0.82%. The two cross at 2:40, and the Fed day finishes wider: 1.16% against 0.92%.
Eight meetings against 262 ordinary sessions, five-minute bars. Be careful which of these differences are established and which are only suggestive. The crossing shape also appears in the 16-meeting hourly sample, but the intraday samples are too small to settle the absolute widths: “narrower all morning” is −0.31pp at p=0.073 (n=16) — suggestive, not proven. “Wider by the close” is p=0.37 in this small sample, but it is established elsewhere, on 218 meetings of daily data: +24.2 bps, p < 0.0001. The intraday view shows you the shape; the long daily sample is what proves the day ends wider.
| By | Fed day | Ordinary day | Gap |
|---|---|---|---|
| 10:30 | 0.441% | 0.534% | −0.093pp |
| 11:30 | 0.506% | 0.685% | −0.180pp |
| 12:30 | 0.556% | 0.779% | −0.222pp |
| 1:30 | 0.567% | 0.876% | −0.309pp |
| 2:30 | 0.761% | 0.946% | −0.185pp |
| 3:30 | 1.127% | 1.002% | +0.125pp |
| 4:00 | 1.212% | 1.049% | +0.163pp |
Sixteen meetings against 458 ordinary sessions, hourly bars, range as a percentage of the prior close.
Second, the timing — when the range gets made
Normalising every day to 100% of itself strips out how wide the day was and leaves only when it happened. This is far more powerful statistically, because it removes the enormous day-to-day variation in volatility — exactly the variation that swamped the p-values on the absolute chart above.
The vertical axis is the share of that day’s own high-low range already set, with every day normalised to 100% of itself. The gold line is eight meetings on five-minute bars; the hollow dots are a separate sample — sixteen meetings on hourly bars, a different date range, a different data source and a different bar size. Through the critical window the two agree to within 1.3 percentage points.
The numbers
| By | Fed day | Ordinary day | Gap |
|---|---|---|---|
| 10:30 | 38.9% | 54.8% | −15.9pp |
| 11:30 | 44.5% | 69.7% | −25.2pp |
| 12:30 | 48.3% | 78.0% | −29.7pp |
| 1:30 | 49.5% | 85.1% | −35.6pp |
| 2:30 | 64.6% | 91.2% | −26.6pp |
| 3:30 | 94.1% | 95.9% | −1.8pp |
| 4:00 | 100% | 100% | — |
Sixteen meetings against 458 ordinary sessions, hourly bars. Share of the range set after 1:30pm: 50.5% on Fed days against 14.9% on ordinary days, a gap of +35.6 points, permutation p < 0.00001.
The press conference is the bigger event
The statement and the press conference are two separate events and they are worth separating. On five-minute bars the single bar covering 1:55–2:00 — the statement landing — takes the day from 50.7% complete to 58.0%: 7.3 points in five minutes. But the half hour from 2:30 to 3:00, when the press conference opens, adds 20.9 points — nearly three times as much. The market reacts more to what the chair says than to what the statement wrote.
The morning is quieter than an ordinary morning
This is the part that is easy to miss. From 9:30 to 2:00 a Fed day travels 0.64% against 0.82% on an ordinary day. The Fed morning is not simply quiet next to its own afternoon; it is narrower in absolute terms than a normal morning. People who would otherwise trade in the morning are waiting. Everything the day gains, it gains after two: 1.00% versus 0.39% in the last two hours, about 2.5× normal.
What this does not say
- A wider range is not a bigger move. Fed days run 24.2 bps wider high-to-low (n=218 since 1999, p < 0.0001), but the absolute close-to-close move is not larger (p=0.52) and the standard deviation of returns is essentially identical (ratio 1.008). The day travels farther without ending farther away.
- It says nothing about direction. The famous Fed-day pop is gone: +38.1 bps in 1999–2011 (p=0.008) decaying to +4.3 bps after 2019 (p=0.79). In the press-conference era Fed days are up less often than ordinary days, 47.5% against 54.5%.
- The sample is small and recent. Sixteen meetings on hourly bars back to October 2023, eight on five-minute bars. The shape reproduces across two independent samples, but its persistence is untested and cannot be tested with intraday history this short.
- It does not know what happens at any one meeting. These are averages over meetings with very different content — hikes, cuts, holds. A base rate is not a forecast.
Method: for each session we compute the full high-low range, then the share of it already set at each moment, normalise every day to itself and average. The null relabels which days are Fed days, 20,000 times, within the same set of sessions. The two samples are independent: hourly bars from Yahoo (from 2023-10-17, 16 meetings against 458 ordinary days) and five-minute bars from our own store (from 2025-08-14, 8 against 262). The meeting calendar — 295 scheduled decisions since 1990 — was sourced two separate ways and reconciled line by line, agreeing 295/295. Historical base rates, not investment advice.
Research · 2026-09-03
Does Apple really rise before an iPhone launch?
The short answer is no. The run-up is not there. The fall is — on the day of the keynote and the day after it, and nowhere else.
“Apple runs up into the iPhone keynote, then sells the news.” That is two claims, and they can be tested separately. Measuring Apple’s excess return against SPY on each trading day around 13 clean September keynotes (2012–2025), benchmarked against the same empirical null the p-values use — 11,663 wholesale shifts of the 13 anchors, median +0.060% a day — the first half is backwards and the second half holds, for exactly two days.
Everyone knows the pattern: Apple rallies into the September iPhone event and gives it back afterwards. Is either half of that true, and if so on which days?
The run-up is not there. Over the ten sessions into the keynote Apple returns +0.22% excess against a null median of +0.61% — it underperforms an ordinary stretch. The selling is real but narrow: the keynote day is −0.59% and day +1 is −0.56%, together −1.16% against a null median of +0.13%. By day +2 it is finished.
It relocates the trade. Anyone long into the event for the run-up is paying for something the data does not contain, and anyone waiting until day +2 to sell has missed all of it. It also shows how a real pattern dies under a search: hunt the best day among sixteen and this one lands at the 83rd percentile of its own null.
Day by day, the shape appears
Each bar is the mean excess return across the 13 keynotes on that trading day. The dashed line is the null’s own median day, +0.060% — not an assumed drift rate, so the picture and the p-values are measured against the same thing.
The two claims, charged separately
Each block is measured against what Apple normally returns over the same number of days. The null shifts the whole 13-anchor set wholesale, 6,000 draws:
| Block | Actual | Null median | Diff | Hit | Empirical p |
|---|---|---|---|---|---|
| Run-up, day −10..−1 | +0.22% | +0.61% | −0.39pp | 7/13 | 0.402 |
| Keynote day 0 | −0.59% | +0.07% | −0.66pp | 4/13 | 0.046 |
| Day 0..+1 | −1.16% | +0.13% | −1.29pp | 5/13 | 0.011 |
| Day 0..+2 | −1.00% | +0.18% | −1.17pp | 4/13 | 0.053 |
| Day +1..+2 only | −0.40% | +0.13% | −0.52pp | 5/13 | 0.166 |
| Day +1..+5 | −0.09% | +0.29% | −0.39pp | 8/13 | 0.330 |
Is it robust, or is it one year?
With n = 13 the first question has to be whether a single year is carrying the result.
- Leave-one-out: no single year. Dropping each keynote in turn leaves the day-0 t between −1.65 (dropping 2013, the largest contributor) and −2.58. The result bends but never breaks.
- The median is more negative than the mean. Median day 0 is −0.73% against a mean of −0.59%, so this is not one outlier dragging an average.
- The sign test is the conservative read. 9 of 13 keynote days were negative, one-sided binomial p = 0.133. Distribution-free, it is suggestive rather than settled.
- The last five were all negative. 2021 through 2025 closed down on day 0 every time (−0.42, −0.87, −1.16, −1.08, −1.72) and down over day 0..+1 every time.
The surface pays up for a day that moves less than usual
Take the realised absolute move on those same 13 keynote days: mean 1.12%, median 1.17%, largest 2.30%. An ordinary Apple day averages 1.24%. The keynote day moves 0.90× a normal day. It is not a big-move day at all.
Zoom in to the minute: the drop is the hour after the keynote
Close-to-close is all a daily bar can tell you. Broken into one-minute bars across the nine keynotes since 2016 — every one of which began at 13:00 ET, without exception in fifteen years — the shape is not what anyone assumes.
| Clock window | vs SPY | t | Verdict |
|---|---|---|---|
| 09:30–13:00, before | −0.70% | −2.63 | weak, not the signal |
| 13:00–14:00, the keynote hour | +0.04% | +0.79 | nothing happens |
| 14:00–15:00 | −0.61% | −9.03 | this is the move |
| 15:00–16:00, into the close | +0.51% | +5.32 | the recovery |
Four clock windows on two stocks is eight cells, so the best of them is charged for the search. Against a max-statistic null — draw nine pseudo-event days from the 243 controls, recompute all eight cells, take the max, four thousand times — the null’s 95th percentile is 3.29 against an observed 9.03. It survives at p < 0.0001. Eight of the nine years are negative by 15:00; 2019 is the exception.
What this study does not claim
It does not claim a tradeable edge. The whole effect is −1.29pp over two days on n = 13, and the most conservative test of it — the sign test — gives p = 0.133, before any borrow, spread or slippage. This is a shape, not a rule.
It does not forecast 9 September 2026. Four of the thirteen keynote days closed higher, including 2019 at +1.20%.
And it does not contradict the coarser test that came first — a 25-day window into the event is not special (event years +3.03% against non-event years +4.38%). A window asks whether the period is unusual and the answer is no. Asking which day is the question this data can actually answer.
Balder-algo-logs · 龙气🤖
The short book — you see what it buys
Positions last from a few hours to a few days. Entries, adds and exits are reported as they happen, and half an hour after the close one card sums up every trade of the day — not the good ones picked afterwards, all of them.
Two strategies, run independently
They are trying to do different things, so they never interfere with each other.
Daily result
One row per session — how many trades closed, how many won, and what the average was. Subscribers get every fill as it happens; this is the public version of the same record, updated after the close.
| Date | Trades | Won | Win rate | Day average | Best | Worst |
|---|---|---|---|---|---|---|
| 2026-10-02 | 3 | 1/3 | 33% | +0.38% | CRWV +5.8% | NVO -2.9% |
| 2026-10-01 | 1 | 0/1 | 0% | -5.03% | LMT -5.0% | LMT -5.0% |
| 2026-09-30 | 1 | 1/1 | 100% | +5.47% | SNOW +5.5% | SNOW +5.5% |
| 2026-09-29 | 1 | 1/1 | 100% | +1.85% | SMTC +1.9% | SMTC +1.9% |
| 2026-09-28 | 3 | 0/3 | 0% | -5.17% | BAC -2.2% | CRCL -7.0% |
| 2026-09-24 | 3 | 1/3 | 33% | -2.20% | IONQ +5.1% | ORCL -6.1% |
| 2026-09-22 | 1 | 0/1 | 0% | -5.32% | SOXS -5.3% | SOXS -5.3% |
| 2026-09-21 | 1 | 1/1 | 100% | +12.10% | ARM +12.1% | ARM +12.1% |
| 2026-09-15 | 1 | 0/1 | 0% | -5.14% | CRCL -5.1% | CRCL -5.1% |
| 2026-09-14 | 1 | 0/1 | 0% | -6.90% | STX -6.9% | STX -6.9% |
| 2026-09-10 | 2 | 0/2 | 0% | -5.01% | IONQ -5.0% | ORCL -5.0% |
| 2026-09-04 | 2 | 1/2 | 50% | +0.80% | MU +5.2% | AVGO -3.5% |
| 2026-09-03 | 6 | 3/6 | 50% | +0.38% | AAPL +6.9% | WMT -6.1% |
| 2026-09-02 | 1 | 1/1 | 100% | +0.12% | CRWD +0.1% | CRWD +0.1% |
| 2026-08-31 | 1 | 0/1 | 0% | -1.19% | MRVL -1.2% | MRVL -1.2% |
| 2026-08-28 | 1 | 0/1 | 0% | -7.92% | IONQ -7.9% | IONQ -7.9% |
| 2026-08-27 | 3 | 2/3 | 67% | +0.58% | NBIS +4.9% | RGTI -4.5% |
| 2026-08-26 | 2 | 0/2 | 0% | -4.72% | QBTS -3.4% | LLY -6.0% |
| 2026-08-25 | 1 | 1/1 | 100% | +0.72% | ASML +0.7% | ASML +0.7% |
| 2026-08-24 | 1 | 0/1 | 0% | -1.82% | NVDA -1.8% | NVDA -1.8% |
| 2026-08-21 | 4 | 3/4 | 75% | +1.15% | QBTS +4.1% | NBIS -1.3% |
| 2026-08-20 | 4 | 0/4 | 0% | -4.47% | UNH -3.0% | IONQ -6.1% |
| 2026-08-19 | 2 | 0/2 | 0% | -3.64% | QBTS -3.2% | ASTS -4.1% |
| 2026-08-18 | 2 | 1/2 | 50% | -1.35% | NFLX +1.3% | RGTI -4.0% |
| 2026-08-17 | 6 | 4/6 | 67% | +1.77% | COHR +9.1% | IBM -1.8% |
| 2026-08-14 | 1 | 1/1 | 100% | +1.80% | GOOGL +1.8% | GOOGL +1.8% |
| 2026-08-13 | 4 | 4/4 | 100% | +2.43% | TSLA +3.7% | IONQ +1.3% |
| 2026-08-12 | 8 | 7/8 | 88% | +3.65% | STX +8.4% | ARM -1.8% |
| 2026-08-11 | 5 | 2/5 | 40% | +0.03% | CRCL +5.5% | MRVL -4.2% |
| 2026-08-10 | 2 | 0/2 | 0% | -1.77% | MCD -1.2% | INTC -2.4% |
| 2026-08-07 | 7 | 3/7 | 43% | +0.08% | IONQ +7.1% | BE -6.5% |
| 2026-08-06 | 3 | 1/3 | 33% | -2.77% | AAPL +1.7% | STX -8.7% |
| 2026-08-05 | 2 | 2/2 | 100% | +4.99% | WDC +8.9% | TSM +1.1% |
| 2026-08-04 | 2 | 2/2 | 100% | +8.13% | ASTS +11.2% | NOK +5.1% |
| 2026-08-03 | 6 | 4/6 | 67% | +0.98% | TSLA +5.3% | CRCL -5.1% |
| 2026-07-31 | 2 | 2/2 | 100% | +5.00% | MRVL +7.8% | QQQ +2.2% |
Every closed trade
Newest first. The record is complete because each entry was published before the outcome was known.
| Symbol | Strategy | Opened | Closed | Entry | Exit | Return |
|---|---|---|---|---|---|---|
| HD | Oversold bounce | 09-28 | 10-02 | 290.57 | 285.46 | -1.8% |
| NVO | Oversold bounce | 09-28 | 10-02 | 38.43 | 37.32 | -2.9% |
| CRWV | V-base | 09-23 | 10-02 | 87.53 | 92.60 | +5.8% |
| LMT | V-base | 09-23 | 10-01 | 531.71 | 504.96 | -5.0% |
| SNOW | V-base | 09-24 | 09-30 | 329.51 | 347.53 | +5.5% |
| SMTC | V-base | 09-29 | 09-29 | 178.57 | 181.87 | +1.9% |
| BAC | Oversold bounce | 09-18 | 09-28 | 57.73 | 56.44 | -2.2% |
| CRCL | V-base | 09-23 | 09-28 | 92.26 | 85.85 | -7.0% |
| AAOI | V-base | 09-25 | 09-28 | 101.07 | 94.68 | -6.3% |
| ORCL | V-base | 09-23 | 09-24 | 145.70 | 136.83 | -6.1% |
| ARM | V-base | 09-24 | 09-24 | 325.55 | 307.19 | -5.6% |
| IONQ | V-base | 09-24 | 09-24 | 42.05 | 44.21 | +5.1% |
| SOXS | V-base | 09-22 | 09-22 | 34.93 | 33.07 | -5.3% |
| ARM | V-base | 09-18 | 09-21 | 264.50 | 296.50 | +12.1% |
| CRCL | V-base | 09-15 | 09-15 | 92.72 | 87.95 | -5.1% |
| STX | V-base | 09-11 | 09-14 | 834.58 | 776.99 | -6.9% |
| IONQ | V-base | 09-09 | 09-10 | 39.10 | 37.14 | -5.0% |
| ORCL | V-base | 09-09 | 09-10 | 162.22 | 154.08 | -5.0% |
| MU | V-base | 09-02 | 09-04 | 945.82 | 994.53 | +5.2% |
| AVGO | Oversold bounce | 08-28 | 09-04 | 375.37 | 362.04 | -3.5% |
| AAPL | Oversold bounce | 08-14 | 09-03 | 307.11 | 328.21 | +6.9% |
| IGV | Oversold bounce | 08-18 | 09-03 | 102.56 | 106.95 | +4.3% |
| CSCO | Oversold bounce | 08-14 | 09-03 | 112.58 | 108.61 | -3.5% |
| WMT | Oversold bounce | 08-18 | 09-03 | 115.41 | 108.42 | -6.1% |
| NFLX | Momentum | 08-19 | 09-03 | 80.54 | 82.67 | +2.6% |
| LLY | Momentum | 08-27 | 09-03 | 1,182.45 | 1,159.63 | -1.9% |
| CRWD | V-base | 09-02 | 09-02 | 202.34 | 202.58 | +0.1% |
| MRVL | V-base | 08-31 | 08-31 | 214.52 | 211.97 | -1.2% |
| IONQ | Momentum | 08-27 | 08-28 | 42.18 | 38.84 | -7.9% |
| NBIS | Momentum | 08-26 | 08-27 | 215.69 | 226.19 | +4.9% |
| RGTI | Momentum | 08-25 | 08-27 | 16.99 | 16.23 | -4.5% |
| IBM | Momentum | 08-19 | 08-27 | 237.39 | 240.57 | +1.3% |
| LLY | Momentum | 08-19 | 08-26 | 1,269.34 | 1,192.80 | -6.0% |
| QBTS | Momentum | 08-26 | 08-26 | 18.58 | 17.94 | -3.4% |
| ASML | Momentum | 08-19 | 08-25 | 1,750.01 | 1,762.61 | +0.7% |
| NVDA | Momentum | 08-19 | 08-24 | 216.92 | 212.97 | -1.8% |
| QBTS | Momentum | 08-20 | 08-21 | 19.04 | 19.82 | +4.1% |
| GLW | Momentum | 08-19 | 08-21 | 152.11 | 153.84 | +1.1% |
| TSM | Oversold bounce | 08-20 | 08-21 | 416.42 | 418.96 | +0.6% |
| NBIS | Oversold bounce | 08-20 | 08-21 | 221.94 | 219.12 | -1.3% |
| IONQ | Momentum | 08-18 | 08-20 | 44.54 | 41.81 | -6.1% |
| RGTI | Momentum | 08-19 | 08-20 | 16.86 | 15.99 | -5.2% |
| UNH | Oversold bounce | 08-17 | 08-20 | 396.69 | 384.87 | -3.0% |
| APP | Oversold bounce | 08-14 | 08-20 | 320.59 | 308.98 | -3.6% |
| QBTS | Momentum | 08-18 | 08-19 | 19.69 | 19.06 | -3.2% |
| ASTS | Momentum | 08-05 | 08-19 | 67.20 | 64.47 | -4.1% |
| RGTI | Momentum | 08-13 | 08-18 | 18.77 | 18.02 | -4.0% |
| NFLX | Momentum | 08-17 | 08-18 | 77.81 | 78.80 | +1.3% |
| IONQ | Momentum | 08-17 | 08-17 | 45.73 | 46.33 | +1.3% |
| IBM | Momentum | 08-12 | 08-17 | 233.44 | 229.33 | -1.8% |
| QBTS | Momentum | 08-17 | 08-17 | 20.79 | 21.10 | +1.5% |
| NVDA | Momentum | 08-14 | 08-17 | 225.50 | 227.85 | +1.0% |
| COHR | Oversold bounce | 08-14 | 08-17 | 321.85 | 351.23 | +9.1% |
| SPY | Oversold bounce | 08-14 | 08-17 | 777.39 | 772.65 | -0.6% |
| GOOGL | Momentum | 08-12 | 08-14 | 342.81 | 348.98 | +1.8% |
| QBTS | Momentum | 08-10 | 08-13 | 20.60 | 21.17 | +2.8% |
| NFLX | Momentum | 08-12 | 08-13 | 74.33 | 75.79 | +2.0% |
| IONQ | Momentum | 08-13 | 08-13 | 45.55 | 46.13 | +1.3% |
| TSLA | Oversold bounce | 08-10 | 08-13 | 327.74 | 339.96 | +3.7% |
| WDC | Momentum | 08-06 | 08-12 | 423.31 | 452.60 | +6.9% |
| MU | Momentum | 08-06 | 08-12 | 851.34 | 904.46 | +6.2% |
| TSM | Momentum | 08-07 | 08-12 | 418.07 | 428.06 | +2.4% |
| STX | Momentum | 08-10 | 08-12 | 816.99 | 885.94 | +8.4% |
| IONQ | Momentum | 08-10 | 08-12 | 42.62 | 44.34 | +4.0% |
| ARM | Momentum | 08-12 | 08-12 | 273.26 | 268.26 | -1.8% |
| MCD | Momentum | 08-11 | 08-12 | 271.94 | 274.80 | +1.1% |
| HOOD | Oversold bounce | 08-10 | 08-12 | 93.07 | 94.91 | +2.0% |
| MRVL | Momentum | 08-04 | 08-11 | 219.71 | 210.57 | -4.2% |
| GOOGL | Momentum | 08-11 | 08-11 | 353.41 | 349.59 | -1.1% |
| CRCL | Momentum | 08-10 | 08-11 | 66.61 | 70.29 | +5.5% |
| NFLX | Momentum | 08-11 | 08-11 | 75.92 | 76.72 | +1.1% |
| ARM | Momentum | 08-10 | 08-11 | 270.64 | 267.39 | -1.2% |
| INTC | Momentum | 08-07 | 08-10 | 99.33 | 96.98 | -2.4% |
| MCD | Momentum | 08-07 | 08-10 | 275.54 | 272.34 | -1.2% |
| ORCL | Momentum | 08-04 | 08-07 | 146.74 | 145.16 | -1.1% |
| STX | Momentum | 08-07 | 08-07 | 827.41 | 780.91 | -5.6% |
| ARM | Momentum | 08-07 | 08-07 | 282.50 | 278.97 | -1.2% |
| BE | Momentum | 08-04 | 08-07 | 230.75 | 215.80 | -6.5% |
| IONQ | Momentum | 08-05 | 08-07 | 40.23 | 43.07 | +7.1% |
| RGTI | Momentum | 08-05 | 08-07 | 16.89 | 17.88 | +5.9% |
| TSLA | Oversold bounce | 08-04 | 08-07 | 322.06 | 328.57 | +2.0% |
| STX | Momentum | 08-04 | 08-06 | 863.59 | 788.72 | -8.7% |
| IBM | Momentum | 08-05 | 08-06 | 234.50 | 231.47 | -1.3% |
| AAPL | Oversold bounce | 08-03 | 08-06 | 307.30 | 312.40 | +1.7% |
| TSM | Momentum | 08-04 | 08-05 | 416.20 | 420.61 | +1.1% |
| WDC | Momentum | 08-03 | 08-05 | 515.51 | 561.49 | +8.9% |
| ASTS | Momentum | 08-03 | 08-04 | 63.51 | 70.62 | +11.2% |
| NOK | Oversold bounce | 07-31 | 08-04 | 9.44 | 9.92 | +5.1% |
| CRCL | Momentum | 07-31 | 08-03 | 62.01 | 58.85 | -5.1% |
| INTC | Momentum | 08-03 | 08-03 | 87.78 | 90.67 | +3.3% |
| IBM | Oversold bounce | 07-29 | 08-03 | 224.37 | 226.30 | +0.9% |
| SPCX | Oversold bounce | 07-29 | 08-03 | 115.40 | 114.47 | -0.8% |
| TSLA | Oversold bounce | 07-29 | 08-03 | 305.80 | 322.07 | +5.3% |
| SPY | Oversold bounce | 07-31 | 08-03 | 740.37 | 757.69 | +2.3% |
| QQQ | Oversold bounce | 07-30 | 07-31 | 678.30 | 693.29 | +2.2% |
| MRVL | Oversold bounce | 07-30 | 07-31 | 178.11 | 192.00 | +7.8% |
Home/Products/Balder's Position
Balder’s Position
The long book — every name, in and out
Uptrend trend-following. Published after the close, so you can take it in the after-hours session or the next morning — the holding period is long enough that the first few minutes do not decide the trade. Every position carries its reasoning.
Disclosed on the way in and on the way out — which is why the table below is complete by construction. There is no version of it with the losers removed.
| Symbol | In | Out | Entry | Last / exit | Return | Held |
|---|---|---|---|---|---|---|
| SMTC | OPEN | 131.56 | 194.88 | +48.1% | — | |
| META | OPEN | 616.15 | 728.08 | +18.2% | — | |
| IONQ | OPEN | 45.48 | 43.77 | -3.8% | — | |
| AMAT | OPEN | 512.01 | 540.04 | +5.5% | — | |
| LITE | OPEN | 971.26 | 1,085.42 | +11.8% | — | |
| ASML | OPEN | 1,808.49 | 1,867.31 | +3.3% | — | |
| CRWV | OPEN | 89.62 | 89.62 | +0.0% | — | |
| MDB | 09-24 | 09-30 | 423.86 | 348.61 | -17.8% | 6d |
| COIN | 09-22 | 09-25 | 201.07 | 195.11 | -3.0% | 3d |
| OXY | 09-10 | 09-18 | 60.89 | 58.84 | -3.4% | 8d |
| NVDA | 09-01 | 09-11 | 217.87 | 218.99 | +0.5% | 10d |
| VRT | 09-08 | 09-11 | 293.71 | 257.65 | -12.3% | 3d |
| NFLX | 08-06 | 09-10 | 73.53 | 75.79 | +3.1% | 35d |
| CRWD | 09-04 | 09-09 | 212.65 | 207.76 | -2.3% | 5d |
| AAPL | 09-07 | 09-09 | 321.75 | 315.86 | -1.8% | 2d |
| QCOM | 09-04 | 09-08 | 167.56 | 172.88 | +3.2% | 4d |
| NET | 09-01 | 09-04 | 287.01 | 279.24 | -2.7% | 3d |
| LLY | 08-17 | 09-03 | 1,188.23 | 1,157.92 | -2.6% | 17d |
| ORCL | 09-01 | 09-03 | 141.21 | 155.95 | +10.4% | 2d |
| IONQ | 07-31 | 08-28 | 36.52 | 38.86 | +6.4% | 28d |
| IBM | 08-03 | 08-27 | 225.71 | 238.60 | +5.7% | 24d |
| RGTI | 07-28 | 08-26 | 14.46 | 16.03 | +10.9% | 29d |
| QBTS | 07-28 | 08-26 | 17.68 | 17.64 | -0.2% | 29d |
| NBIS | 08-24 | 08-26 | 210.49 | 215.00 | +2.1% | 2d |
| ASML | 08-18 | 08-24 | 1,790.30 | 1,754.53 | -2.0% | 6d |
| NVDA | 08-13 | 08-21 | 226.04 | 214.96 | -4.9% | 8d |
| ASTS | 07-28 | 08-20 | 55.45 | 64.01 | +15.4% | 23d |
| GLW | 08-18 | 08-20 | 159.53 | 151.65 | -4.9% | 2d |
| BRK-B | 08-03 | 08-15 | 517.22 | 505.97 | -2.2% | 12d |
| GOOGL | 08-06 | 08-13 | 357.54 | 346.03 | -3.2% | 7d |
| MCD | 08-06 | 08-12 | 275.65 | 275.04 | -0.2% | 6d |
| INTC | 07-29 | 08-12 | 81.88 | 102.50 | +25.2% | 14d |
| ARM | 07-30 | 08-12 | 241.54 | 274.30 | +13.6% | 13d |
| WDC | 07-29 | 08-11 | 462.04 | 437.67 | -5.3% | 13d |
| MU | 08-03 | 08-11 | 829.50 | 861.22 | +3.8% | 8d |
| TSM | 08-03 | 08-11 | 406.11 | 420.79 | +3.6% | 8d |
| STX | 07-28 | 08-11 | 747.30 | 821.22 | +9.9% | 14d |
| BE | 07-30 | 08-10 | 209.63 | 212.39 | +1.3% | 11d |
| UNH | 07-29 | 08-10 | 420.57 | 408.38 | -2.9% | 12d |
| MRVL | 08-06 | 08-10 | 210.54 | 213.69 | +1.5% | 4d |
| CRCL | 07-31 | 08-10 | 62.61 | 66.25 | +5.8% | 10d |
Handbook · 订阅使用说明书
How to use the subscription
Three channels, identical content — pick whichever is easiest. If you subscribe on X, do it in a web browser: subscribing inside the iOS app adds Apple's 30% cut.
When each thing arrives
All times are US Eastern, on market days only — nothing goes out on weekends or exchange holidays. These stay fixed across the daylight-saving switch; what moves is your local clock.
The two SPX structure reads go to email members (Venmo / Substack) only. The Earnings Radar fires only on days a name we cover actually reports — a quiet day with no report sends nothing, which is expected rather than a miss. The Structure Read lives on the website and is never emailed.
1 · Balder-algo-logs — the short book
Close to a follow-along feed: you see what it buys, as it buys it. It runs two strategies, oversold bounce and momentum, holds from a few hours to a few days, reports every trade live, and posts one summary card half an hour after the close.
The two strategies run independently and never interfere — they are trying to do different things. Every closed trade is here →
2 · Balder’s Position — the long book
Uptrend trend-following. It goes out after the close, so you can trade it in the after-hours session or the next morning — the horizon is long enough that the first few minutes do not decide it. Every position comes with its reasoning and analysis; ask if any part of it isn't clear.
Disclosed on entry and on exit, so the record is complete — winners and losers both. See the record →
3 · Earnings Radar
The badge in the top-right corner is the whole read:
Green — the model expects up
Red — the model expects down
Grey — coin-flip, the model is
making no call at all
Grey does not mean "unsure". It means the model declined to act, and those are excluded from the record rather than scored as free wins. The scored history is here →
4 · What is free
The SPX cone and the 24/7 board are free to everyone right now — no subscription needed.
24/7 board → SPX probability cone → Free Discord →
5 · What comes next
More tutorials, more strategies, more products — the research loop runs continuously and what survives gets published.
Membership · Beta
Trade with Balder
One price, three ways to pay, identical content on every one of them — the marked book, the cone, the radar, and the reasoning behind each call. What you get, in detail →
Also on Substack at $15 — same thing, SPX reads included. X is $10 and carries the research letter, but not the twice-daily SPX structure reads (subscribe on the web, not in the app — the app adds Apple's 30%). Full handbook →
- Send $12 for each month you want on Venmo — $36 gets you three.
- Put your email address in the payment note. That is the only way we know where to send you.
- The system reads the payment and enrols you automatically — usually within half an hour, no forms.

Account
Sign in, or create an account
An account does not change what you can read yet — the site is still fully open. It records who you are, ready for member content later.
No login needed — there is no door
You do not need an account. Every page on this site is readable right now, and nothing is held back behind a sign-in. The account system is not finished, so rather than leave you at a login box that cannot work, here is the honest version: just go and read it.
Go straight to these
Market Risk Playbook
Today’s range, the level that matters, and the probabilities from history.
Open it →Structure Read
The desk chart, with layers you can toggle and any session readable on hover.
Open it →Research
What we tested, what survived, and what did not.
Open it →404
That page isn’t here.
The address you followed doesn’t match anything on this site — most likely a link from before the pages moved to their own addresses. Everything the desk publishes is one click away.
Elsewhere
Follow the desk
The daily posts run on X, long-form goes to Substack, and the community room is free to join — no payment needed for any of those.
X · @Balder13946731
The read as it happens — market calls, filings, and the charts from this desk.
Follow on X →Substack · baldertrader
The letters, the research write-ups, and everything that needs more than a post.
Read on Substack →Markets Around the Clock
The live 24/7 price board — SPX, NDX and the stocks that actually trade overnight.
Open the board →Discord
Ask questions, argue with the calls, and see what other members are trading.
Join the room →